
Dow Jones Global Index: A Timeless Symphony of Global Markets
Update Feb 27, 2024
The Dow Jones Global Index is an exceptional financial instrument meticulously crafted to represent the global stock market landscape comprehensively. It encompasses 150 elite companies handpicked by esteemed Dow Jones editors. The index highlights organizations with a rich legacy of success and a strong appeal among discerning investors.
Employing an equal-weighted approach, the Global Dow ensures an unbiased and sophisticated snapshot of the global economy. It casts a discerning eye over developed and burgeoning markets, striving to encompass 95% of global market capitalization. This ambitious goal underscores the index’s dedication to providing a well-rounded, insightful perspective on the intricacies of the international financial stage.
The Market’s Melodic Movements
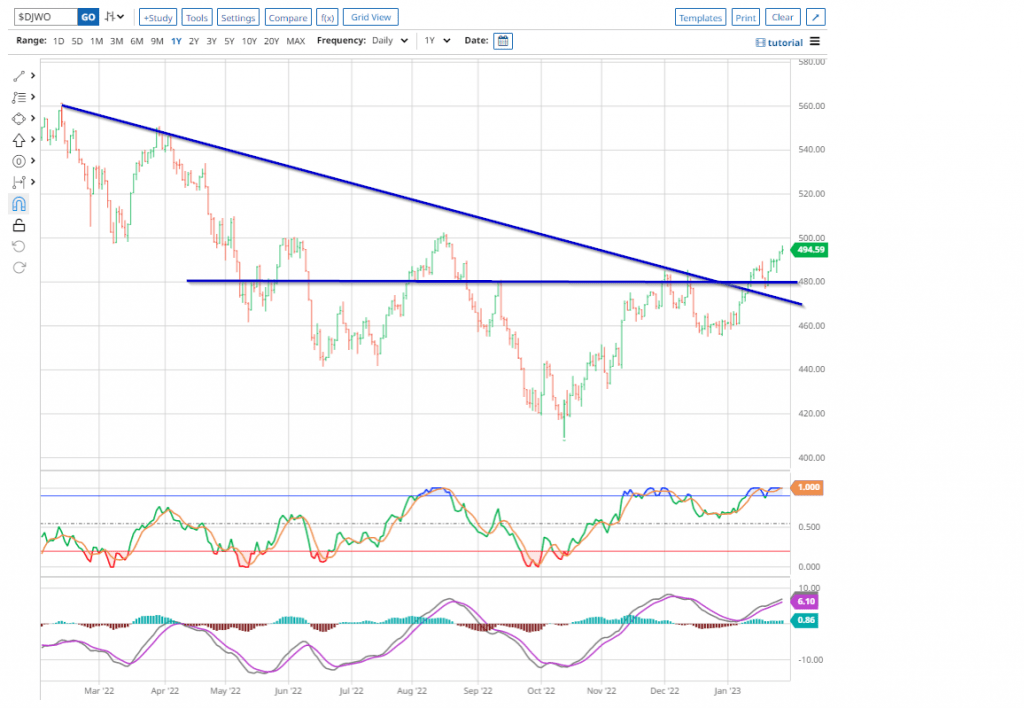
So, what is the Dow Jones Global Index proclaiming today? The upward breakout in the chart below is a favourable sign, pointing towards the possibility of a multi-month bottom. It is essential to have support from other indices, as the pattern should be seen in the charts spanning 24 and 36 months. Further confirmation is close at hand. The downtrend line in the 2-year chart of the Dow Jones Global Index is dangerously close to being broken to the upside, further reinforcing the bullish outlook. 9 out of 10 times, such patterns are early precursors of the Market, putting in a multi-month bottom.
Harmonious Sentiment Divergences
The long-term chart of the Dow Jones Global Index:
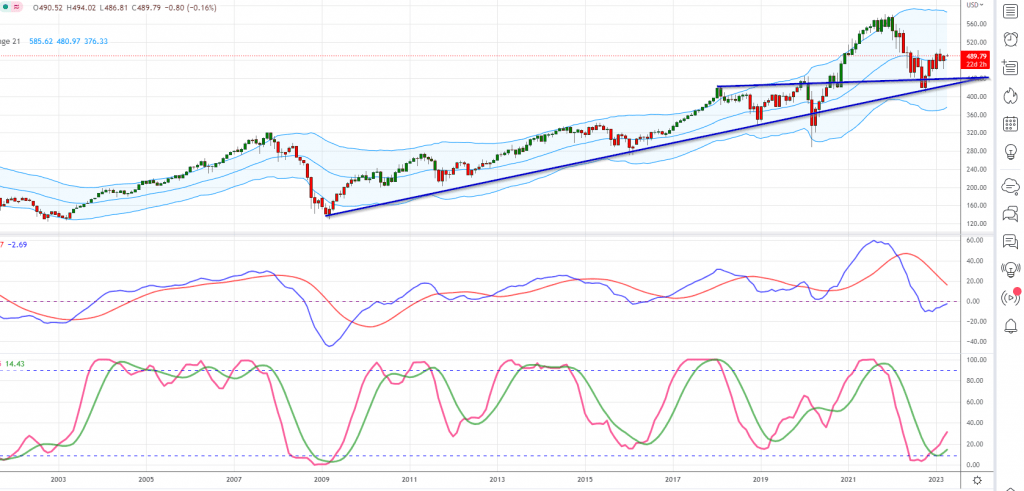
As long as it does not close below 420 on a monthly basis, the outlook will remain neutral with a bullish bias. In contrast, a monthly close at or above 510 will signal a test of 560 is in the works.
On the sentiment front, there are some divergences:
Bullish sentiment has traded below its historical average for over a year, even when the Dow has mounted rallies exceeding 2000 plus points. Highly unusual action.
Bearish sentiment has not spiked to the 63-65 range. If fear were running high, it would have remained at this level for at least two weeks.
More importantly, if you look at the sentiment data, you will notice that individuals are jumping from the bearish to bullish camps. We have not seen one massive spike in neutral readings. Hence, while the masses are scared, they are not in panic mode. Too many individuals think they can jump from the bullish to bearish camp and game the market. One of the following needs to occur:
For a market bottom to be considered tradable and sustained for six months or more, bullish sentiment readings should decline to the 10-12 range or bearish sentiment readings to increase to above 63. The most favourable scenario is when neutral sentiment rises above 55, as a neutral reading at or above 55 strongly correlates with establishing a market trough, indicating that the bulls and bears have been crushed/neutralized.

The Finale: Projections and Possibilities
In the current market climate, technical analysis and mass psychology offer valuable insights to shape future expectations. The Dow Jones Global Index breaking its 12-month downward trend line is a promising sign of recovery, signalling that the market may be stabilising. However, for this bullish outlook to fully materialize, it must overcome critical resistance levels. Specifically, the Dow Jones Industrials faces an immediate hurdle at 34,150. If the index closes above this key level every week, it could confirm the continuation of a long-term upward trend. Failure to do so, however, could result in a temporary pullback, potentially revisiting the December or even September lows. This highlights the psychological tug-of-war between optimism and caution as traders assess whether the worst is truly over.
Similarly, the S&P 500 has pierced its 12-month downward trend line, reflecting broader market strength. The convergence of technical signals across these major indices suggests a significant turning point may be near. However, we anticipate one final corrective wave that could be triggered by a climactic about of selling. In mass psychology, this is often referred to as the “capitulation phase,” where fear and pessimism peak, causing many investors to throw in the towel. History has shown that this phase typically precedes a major market bottom, and investors who can withstand the emotional pressure stand to gain the most. A higher low in one of the indices could provide a positive divergence, serving as a strong buy signal for those with a long-term perspective.
A market characterized by such wide price swings is an ideal environment for technical analysis. Historical price charts from previous corrections show the effectiveness of tracking trend lines, moving averages, and momentum oscillators in identifying potential buying opportunities. Coupling these technical tools with an understanding of mass psychology—specifically, how fear drives overselling—allows investors to anticipate moments of extreme undervaluation.
Navigating Market Cycles: Fear, Euphoria, and Rationality
As we examine the broader implications of current market trends, it becomes evident that technical analysis works best when combined with an understanding of mass psychology. For instance, the Dow Jones Global Index can be seen as a microcosm of global market sentiment. The shift in investor mood—often oscillating between fear and euphoria—plays a crucial role in driving price movements.
During the late stages of a bull market, herd mentality typically takes over, pushing prices far beyond their intrinsic values. This is where technical indicators like the Relative Strength Index (RSI) and Bollinger Bands can help identify overbought conditions, signalling that the market may be nearing a top. The exuberance of the masses often blinds them to underlying risks, as seen in the dot-com bubble of the late 1990s or the housing market bubble leading up to the 2008 financial crisis. Investors who can detach themselves from the collective euphoria and look at technical signals objectively have a better chance of protecting their capital during such speculative frenzies.
Conversely, bear markets are driven by fear, where mass psychology leads to widespread selling even as fundamentals remain intact. This is when contrarian investors step in, using tools like Fibonacci retracement levels and the MACD (Moving Average Convergence Divergence) to identify potential reversal points. An excellent example occurred during the COVID-19 market crash in March 2020. Despite the panic, several indices and sectors formed higher lows on their charts, a classic sign of positive divergence. Investors who recognized these signals and acted on them were rewarded handsomely as markets rebounded sharply in the following months.
The Art of Contrarian Investing: Breaking Away from the Crowd
To succeed in today’s volatile market, investors must rely on technical indicators and develop a keen awareness of the psychological forces at play. Herd mentality, the tendency to follow the crowd, can be a powerful driver of market trends, but it also leads to excessive risk-taking and eventual losses. This is where contrarian investing comes into play. By going against the prevailing sentiment, contrarian investors position themselves to profit from market reversals.
One of the most famous contrarian investors, John Templeton, made his fortune by buying during periods of maximum pessimism. His belief that the best opportunities arise when everyone else is fearful aligns perfectly with mass psychology principles. Templeton’s strategy of “buying when there’s blood in the streets” can be applied today by identifying oversold conditions using technical analysis. For instance, when an index hits its 200-day moving average, and sentiment indicators show extreme pessimism, this often marks a key buying opportunity. Recent examples include the energy sector in 2020, when crude oil prices fell to historic lows. Savvy investors who saw this as a temporary dislocation in an otherwise healthy long-term market profited as energy stocks rallied strongly in 2021 and beyond.
By incorporating mass psychology into technical analysis, investors gain a deeper understanding of market cycles and are better equipped to anticipate turning points. Whether navigating euphoric bull markets or fear-driven corrections, the key to success lies in recognizing that the crowd is often wrong at major inflexion points. With this knowledge, contrarian investors can move confidently while others hesitate, capturing opportunities that the majority overlook.
Embracing Market Complexity: The Path Forward
As we look to the future, the lessons of mass psychology and technical analysis remain essential for navigating the complexities of modern markets. The Dow Jones Global Index, having broken its 12-month downward trend line, is a testament to global equities’ resilience. However, the real test lies in surpassing key resistance levels and navigating the final corrective wave many analysts expect.
This phase of market activity presents an ideal environment for applying technical analysis tools like trend lines, support and resistance levels, and momentum indicators. Yet, it is equally important to consider the psychological forces that drive investor behaviour. Recognizing fear-driven selling as a buying opportunity—or conversely, identifying euphoric buying as a sign of an impending correction—can make all the difference in achieving long-term success.
By blending the insights of technical analysis with a deep understanding of mass psychology, investors can better navigate the shifting tides of the global financial landscape. As we move forward, it is clear that those who can maintain emotional discipline, think independently, and act decisively will be best positioned to capitalize on the opportunities.
https://youtu.be/A_uB9bdzF0g
Conclusion
With its upward breakout and potential to break a 24-month downward trend line, the Dow Jones Global Index offers a compelling snapshot of current market conditions. Its equal-weighted approach provides an unbiased view of the global financial landscape, and the recent shift in sentiment suggests that the masses are moving from bearish to cautiously optimistic. However, the psychological battle between fear and greed will continue to play out, making it essential for investors to remain vigilant.
As we anticipate one final corrective wave, monitoring both technical signals and mass psychology indicators is crucial. Whether the market experiences a brief pullback or a more substantial correction, those who understand the importance of emotional discipline and contrarian thinking will be well-prepared to capitalize on the next wave of opportunities.
Ultimately, success in investing requires a delicate balance of logic, emotional intelligence, and technical expertise. By mastering these elements and recognizing the powerful influence of mass psychology, investors can navigate the market’s complexities and build a future of financial stability and prosperity.