Dow 2008 Crash: Lessons From the Abyss
Updated Jan 29, 2026
This article was originally published on July 10, 2008, during the heart of the financial crisis. It has been updated over the years, with this latest revision providing historical perspective on one of the most significant market crashes in modern history. The analysis offers valuable lessons for navigating today’s volatile markets.
Looking back at mid-2008, everything that could go wrong had indeed gone wrong. Just as markets appeared poised to stabilize after factoring in months of negative news, the Dow unexpectedly plummeted, breaching its January 2008 lows. What followed became one of the most devastating market collapses since the Great Depression, ultimately taking the Dow from around 11,000 to below 6,500 by March 2009.
At the time, substantial funds amounting to over two trillion dollars sat in money market accounts held by undecided investors who had chosen to remain on the sidelines. Events in July 2008 further spooked these investors, leading them to hold back even longer rather than deploying capital into financial markets. They continued watching and waiting for a more favorable climate that wouldn’t arrive for many more months.
When the Main Uptrend Line Broke
Compounding the problems, the crisis had extended to major institutional investors, particularly massive sovereign wealth funds, resulting in a temporary loss of even more purchasing power. When key psychological levels get breached, it devastates investor confidence across the board.
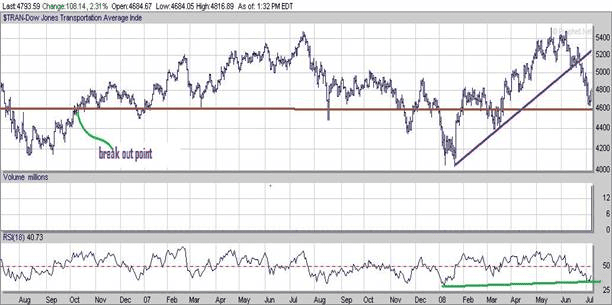
The two-year chart of the Dow Transports at that time showed it had retraced almost entirely to its initial breakout point from October 2006. The fact that this zone held served as a definite positive, since first breakout points often provide robust support. However, the violation of the main uptrend line meant the Transports needed to surge past 5250 for 18 consecutive days to re-establish that uptrend. A recent surge in the Transports, partly influenced by oil’s eight-dollar pullback in just two days, offered temporary relief.
A negative factor was that the uptrend line broke after hitting a new high. In technical analysis terms, it was actually fortunate this occurred post-new high. Breaking the uptrend line before achieving a new high would have represented a highly unfavorable and precarious development. The transports ideally needed to avoid breaking below 4600 for more than six consecutive days. Such a breakdown would indicate two things: either the oil markets weren’t ready for substantial correction, or the Dow would likely breach 11000 and potentially trade as low as the 10650 to 10800 range before stabilizing.
Oil Sector Signals Impending Market Turmoil
Regarding oil in mid-2008, some positive developments emerged for equities. Almost all major stocks in the oil sector suddenly experienced rapid breakdowns. One could almost say they were already pricing in lower oil prices. Names like APA, BPT, XOM, PBR, and YPF had broken down fast in just a few days. Coupling this with the fact that Iran was hoarding millions of barrels of oil in tankers hoping for higher prices, it suggested an intermediate top was close at hand.
Mass psychology teaches that when a market has experienced a massive run-up and big institutions start loading up shares or hoarding the indicated commodity, some sort of top is close. Governments and large institutions are notorious for jumping in toward the end of a run. Adding the increased speculation in oil futures markets and the many pundits recommending buying oil on all dips, the likelihood of a pullback appeared imminent. If this transpired, it would have substantial positive impact on worldwide equity markets.
Utilities: The Crucial Leading Indicator
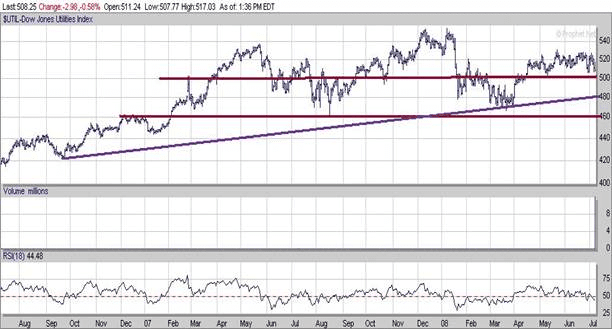
Looking at the two-year chart of utilities from that period, it stood as the only index among transports and Dow Industrials that hadn’t broken below its main uptrend line. This distinction proved extremely important. According to the TI Dow pattern (not to be confused with classic Dow Theory, which is something completely different), it’s the utilities that start the whole process. They must put in new highs before the other two indices follow. Hence it makes sense that if this leader breaks down, it spells bad news for the others.
Given the massive sell-off, utilities held up remarkably well, trading comfortably above their long-term uptrend line. Technically, they could have traded all the way down to 460, which would mean breaking the main uptrend line. But if that happened and utilities could trade back above the main uptrend line within nine days, there would be nothing to worry about. The chances of testing the bottom of the channel formation at 460 remained below 40% at that time. Another bullish factor: utilities hadn’t broken below the top of their current channel formation (495-515 range) despite the massive market sell-off.
The Dow’s Sharp Decline: Seeking Stability
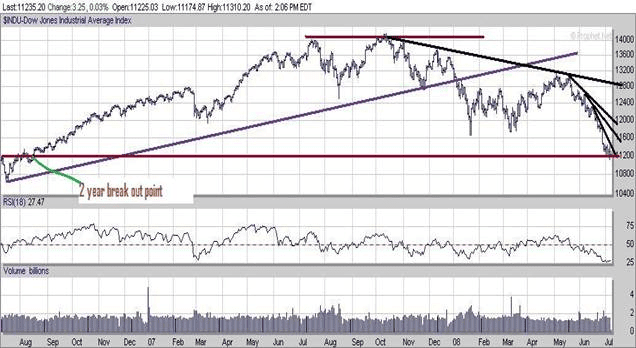
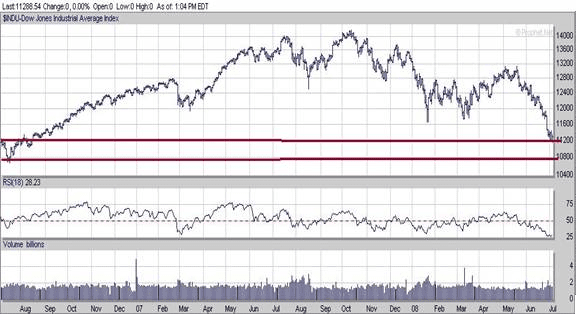
The Dow’s pattern had taken an unappealing turn. Initially a controlled correction suddenly escalated into a rapid-fire pullback, driving the Dow to a low of 11100. As it breached its main uptrend line, a new downtrend line emerged. Furthermore, it swiftly dipped below the January 2008 lows, faster than anyone wanted to see. This zone, which should have offered resistance, provided only token opposition before succumbing to breakdown.
Amidst the chaos, a glimmer of positivity emerged: the Dow was now significantly oversold, with four downtrend lines in place and all technical indicators showing oversold to extremely oversold conditions. It was hovering around its two-year breakout point (approximately 11200), and this zone appeared to be holding steady.
Critical Hurdles for Any Recovery
For the Dow’s situation to undergo significant change, it first needed to breach 11400 and sustain trading in this zone for at least nine consecutive days. Subsequently, surpassing 12000 for six consecutive days would increase the likelihood of breaking through the new downtrend line at 12800 and re-establishing an uptrend.
The decisive break below January 2008 lows introduced a shift in the pattern, prompting consideration of selling and closing many positions during the next rally. The approach wasn’t anchored in stubbornness. There was no holding onto decisions despite market signals. While maintaining a bullish stance in challenging circumstances had worked before, recognizing the importance of adjusting views based on market realities meant setting aside personal pride or ego-driven biases.
To maintain objectivity requires avoiding emotional attachments to markets and refraining from subjective judgments. When patterns change, views must adapt to align with market signals. No one can control market actions. The role is interpreting current conditions and making informed predictions. While accurately predicting market directions in the past was possible, remaining humble and recognizing that no one consistently gets it right prevents misleading claims of expertise.
Bullish and Bearish Factors in Summary
Bullish factors at the time:
- Both Dow utilities and transports had not broken below their January 2008 lows
- Utilities were trending strongly above their main uptrend line
- Even though the transports pulled back, they held above the first breakout point (October 2006)
- Multiple downtrend lines in the Dow suggested some rally should begin shortly
- The Dow was holding above its first breakout point on the two-year chart
Negative factors:
- The Dow broke too fast and too easily below its January 2008 lows and traded significantly below them

The Smart Money Indicator’s Crucial Role
Thankfully, the smart money indicator was holding up well and nowhere near its January lows. If it continued behaving this way, it might actually issue a full-fledged buy signal. The last signal had been tentative because it was 99% into the buy zone but didn’t fully enter the 100% buy zone. A full-fledged signal had the potential to invalidate almost all negative factors listed, though the specific market pattern when any such signal flashed would need investigation. It was a relief that this indicator hadn’t reacted to the correction in the same manner as the Dow and NASDAQ.
The Explosive Pattern: Echoes of 2000-2004
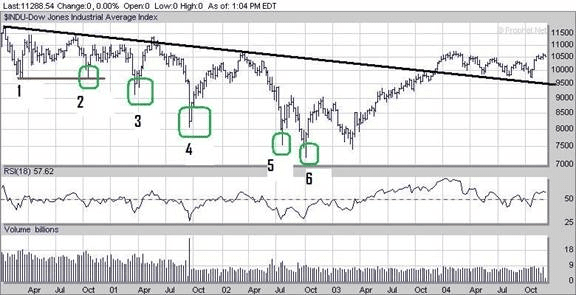
The chart stretching from March 2000 to October 2004 showed a pattern eerily similar to what the Dow was putting out in 2008. The only difference was the timeframe.
After putting in what appeared to be a double bottom (points 1 to 2), the Dow traded lower to point 3 in April 2001. At this point, it looked like a long-term bottom was finally in place. Several positive divergence signals flashed, and the smart money indicator was very close to the buy zone (almost 96% into it).
The Dow then mounted what appeared to be a powerful rally, taking it from 9200 all the way to 11200 in months. However, the rally broke down, old lows failed to hold, and the Dow put in yet another low (point 4). Again, the smart money indicator refused to flash a buy signal even though it was pretty close to the buy zone (almost 93% in).
Markets were extremely oversold, so they mounted an impressive rally adding roughly 2500 points to the Dow before it ended, taking the Dow from roughly 8000 to 10500.
This rally also failed, and the Dow put in yet another new low (point 5). Several strong positive divergence signals flashed, but the smart money indicator was in neutral territory. Perhaps this was a clue that bottom wasn’t yet in. After mounting a brief rally, the Dow put in another low (point 6). This time, the smart money indicator flashed a strong buy together with several other indicators, and several very strong positive divergence signals also flashed.
The rally that followed was very strong indeed, taking the Dow from below 7500 all the way to 10500 plus, a whopping gain of over 47%.
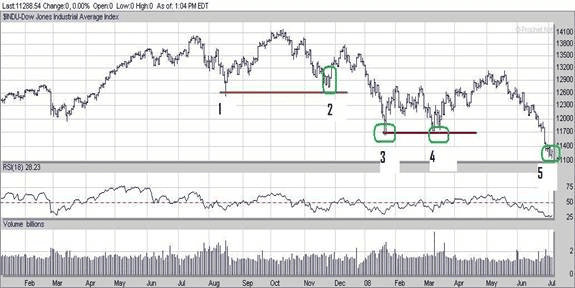
Pattern Recognition Across Different Timeframes
Looking at the 2008 chart spanning roughly 18 months, powerful similarities emerged between the two periods. One important observation: in modern markets, what used to take years can now occur in months, and what used to take months now happens in weeks. Thus a pattern taking 3-4 years to complete can now finish in less than one year.
Points 1 to 2 corresponded very well with points 1 to 2 on the first chart. Similarly, the Dow put in a new low (point 3) after breaking through what appeared to be a strong double bottom formation, precisely what took place in the first chart. The only difference was reaction speed: the second time around, everything appeared to be taking place twice as fast.
Up to point 3, the pattern was almost identical. After that, it changed slightly. In the first chart, the Dow put in another low (point 4), while in 2008, the Dow put in what looked like yet another double bottom formation (3 to 4).
What Actually Happened: The 2008 Crash in Retrospect
History now tells us the outcome. The Dow did follow a similar pattern but with even more devastating consequences. From July 2008, markets experienced a brief summer rally before the catastrophic collapse in September and October 2008 following Lehman Brothers’ bankruptcy. The Dow ultimately bottomed near 6,500 in March 2009 before beginning the longest bull market in history.
The smart money indicator’s reluctance to flash a full buy signal in mid-2008 proved prescient. The bottom wasn’t truly in until early 2009, after massive government intervention, unprecedented Federal Reserve action, and complete capitulation by investors. Those who recognized the pattern and maintained discipline ultimately positioned themselves for extraordinary gains in the decade-long rally that followed.

Additional Observations From July 25, 2008
Since the initial writing in early July 2008, the Dow had declined below 11000, reaching an intraday low of 10872 before finding stability. Interestingly, the transports also broke below 4600, accompanied by a volume surge past 7.4 billion, marking a new record. This selling frenzy resulted in widespread asset dumping, indicating a significant market turning point. However, based on the subsequent rally, some level of bottoming had occurred, at least temporarily. Another positive sign: the VIX spiked past 30 for the first time in months.
Oil had sharply pulled back, dropping around 24 dollars in less than two weeks, leading to bullish market response. The Dow rallied approximately 850 points from its July 15th low to its July 23rd high before experiencing a pullback.
Leave this hypocritical prating about the masses. Masses are rude, lame, unmade, pernicious in their demands and influence, and need not to be flattered but to be schooled. I wish not to concede anything to them, but to tame, drill, divide, and break them up, and draw individuals out of them.
Ralph Waldo Emerson, 1803-1882, American Poet, Essayist

The Enduring Lessons From 2008
The pattern the Dow put in from 2001 to 2004 bore an uncanny resemblance to what unfolded in 2008. While the analysis at the time anticipated a strong summer rally followed by another decline, nobody fully anticipated the magnitude of the eventual crash. The Dow ultimately fell far below any projected support levels, teaching investors that in genuine financial crises, technical levels can be completely overwhelmed by fundamental panic.
What ultimately mattered was maintaining discipline, avoiding emotional decisions, and recognizing that extreme oversold conditions eventually create extraordinary buying opportunities. Those who bought quality stocks near the March 2009 lows experienced some of the greatest returns in market history over the following decade.
The 2008 crash remains essential study for today’s investors. Markets in 2026 face their own challenges, but the psychological patterns remain remarkably consistent. Fear drives investors to sell at bottoms. Greed drives them to buy at tops. The disciplined contrarian who understands mass psychology and technical analysis positions themselves to capitalize when others panic. That lesson from 2008 remains as relevant today as ever.