


Understanding the Kansas City Financial Stress Index
Jan 14, 2025
The Kansas City Financial Stress Index (KCFSI) measures financial market stress in the United States, and it has long been a topic of interest for investors, economists, and market observers. The index was created in the early 1990s by the Federal Reserve Bank of Kansas City and has since become a well-respected barometer of market stress. This post will explore the KCFSI and its relevance to market bottoms and tops, taking a contrarian and academic approach.
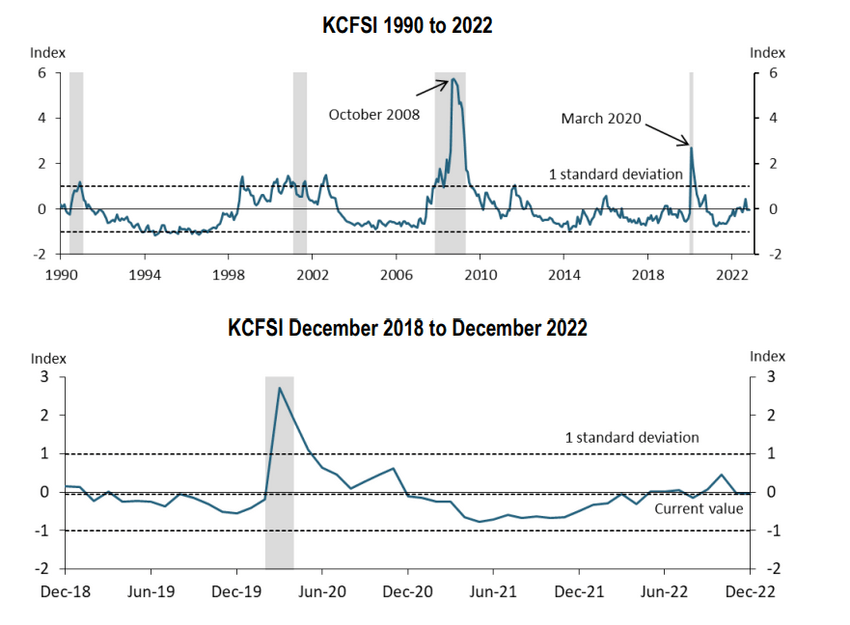
The KCFSI is a composite index of 18 different financial market indicators combined to give a single number reflecting the current level of financial market stress. The index’s indicators include interest rate volatility, credit spreads, and market liquidity. The higher the KCFSI reading, the greater the level of financial market stress, and vice versa.
The KCFSI is a Reliable Indicator of Market Stress
The KCFSI has proven its reliability as an indicator of market stress, consistently identifying market bottoms and tops. Market bottoms emerge during periods of heightened financial stress, reflected in elevated KCFSI readings. Conversely, market tops coincide with low-stress levels, indicated by subdued KCFSI readings.
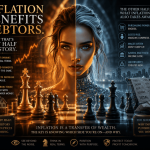
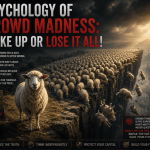
However, mass psychology often plays a crucial, yet underestimated, role in these transitions. Investor sentiment, shaped by collective emotions and crowd behaviour, often overrides rational decision-making. During bull markets, optimism feeds a bandwagon effect, where investors, influenced by others’ successes, chase rising prices without fully evaluating the underlying risks. This herd mentality inflates bubbles, paving the way for eventual market tops. Conversely, during bear markets, fear dominates, amplifying selling pressures and creating conditions for market bottoms. The KCFSI captures these psychological extremes, offering investors a window into the collective mindset driving market movements.
Using the Kansas City Financial Stress Index (KCFSI) to Identify Market Turning Points
The KCFSI is also a powerful tool for identifying market turning points. These inflexion points often signal a reversal in market trends and can serve as early warnings of approaching tops or bottoms. By analyzing changes in financial stress, the KCFSI highlights critical shifts—rising stress often signals an impending top, while extreme stress heralds imminent market bottoms.
Cognitive biases play a pivotal role in how investors interpret these signals. Confirmation bias, for example, leads market participants to favor information that aligns with their existing views—bullish investors may dismiss rising KCFSI readings as noise. In contrast, bearish investors might overstate their significance. Anchoring bias can also skew judgment, as investors fixate on recent market conditions and fail to adjust their expectations to reflect shifting realities. Recognizing these biases and using the KCFSI as an objective guide can help investors navigate turbulent markets more clearly and precisely.
The KCFSI is not just a technical tool; it’s a mirror reflecting the psychological and behavioural underpinnings of market stress. By understanding the interplay of financial data, mass psychology, and cognitive biases, investors can better anticipate market turning points and adapt their strategies accordingly.
Using the KCFSI to Buy Stocks at the Right Time: Real Examples
The Kansas City Financial Stress Index (KCFSI) can be a powerful tool for identifying opportune moments to buy stocks, especially during periods of high financial stress when market sentiment is overwhelmingly negative. Here are two real examples of how investors can use the KCFSI to make informed decisions:
Example 1: The 2008 Financial Crisis
During the 2008 financial crisis, the KCFSI reached unprecedented levels, indicating extreme financial stress. Legendary investor Warren Buffett famously advised to “be fearful when others are greedy and greedy when others are fearful.” Following this principle, Buffett made significant investments during the crisis, including his notable purchase of Goldman Sachs and General Electric shares. By buying when the KCFSI was at its peak, Buffett capitalized on the market’s eventual recovery, demonstrating the effectiveness of using the KCFSI to identify buying opportunities during periods of high stress.
Example 2: The COVID-19 Pandemic
In early 2020, the onset of the COVID-19 pandemic caused a sharp spike in the KCFSI, reflecting heightened financial stress and market volatility. Renowned investor Ray Dalio, founder of Bridgewater Associates, emphasized the importance of diversification and maintaining a long-term perspective during such turbulent times. Investors who followed Dalio’s advice and used the KCFSI to gauge market stress could have identified the market bottom in March 2020. By investing in a diversified portfolio of quality stocks during this period of high stress, they would have benefited from the subsequent market rebound as the global economy began to recover.
These examples illustrate how the KCFSI can serve as a valuable indicator for making strategic investment decisions during periods of financial stress, aligning with the wisdom of some of the best investors of all time.

Conclusion: The KCFSI—A Weapon for the Bold
The Kansas City Financial Stress Index isn’t just a tool—it’s a battlefield weapon for those ready to outwit the market’s manic swings. It strips away the noise of sentiment and exposes the raw nerves of financial stress. But using it requires steel: the courage to defy the herd, the clarity to recognize cognitive traps, and the discipline to act when fear or greed blinds everyone else.
In the end, markets don’t reward the comfortable. They reward the contrarian who understands that panic births opportunity and euphoria signals danger. The KCFSI doesn’t just reveal market stress—it tells the truth. The question is: will you have the conviction to listen?
Other Articles of Interest


US Stock Market Fear and Greed Index: Embrace Fear, Shun Joy
