
Understanding the Kansas City Financial Stress Index
Updated April 30, 2024
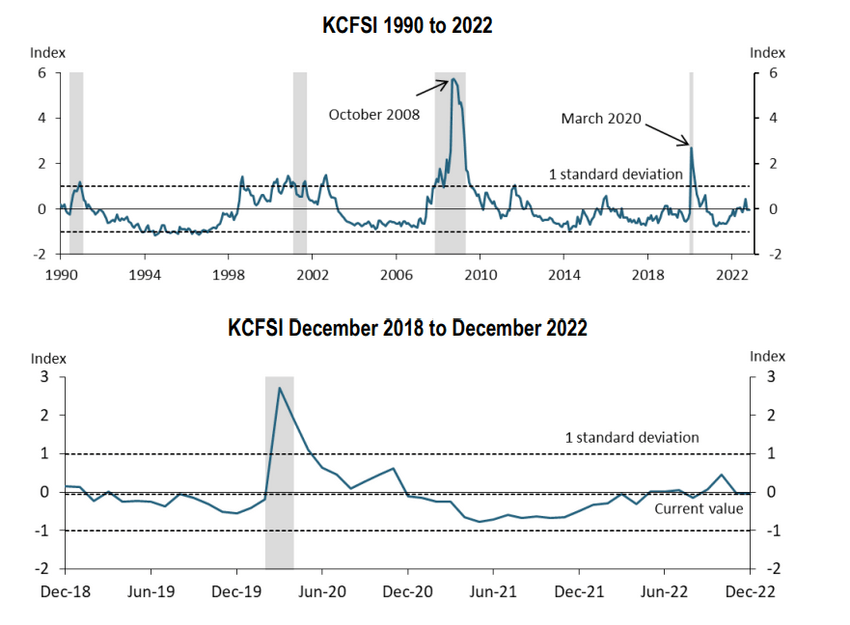
The Kansas City Financial Stress Index (KCFSI) measures financial market stress in the United States, and it has long been a topic of interest for investors, economists, and market observers. The index was created in the early 1990s by the Federal Reserve Bank of Kansas City and has since become a well-respected barometer of market stress. This post will explore the KCFSI and its relevance to market bottoms and tops, taking a contrarian and academic approach.
The KCFSI is a composite index of 18 different financial market indicators combined to give a single number reflecting the current level of financial market stress. The index’s indicators include interest rate volatility, credit spreads, and market liquidity. The higher the KCFSI reading, the greater the level of financial market stress, and vice versa.
The KCFSI is a reliable Indicator of Market Stress.
The KCFSI has been a reliable indicator of market stress over the years, and it has a good track record of predicting market bottoms and tops. Market bottoms are characterized by a high level of financial market stress, which is reflected in a high reading on the KCFSI. Conversely, market tops are characterized by low financial market stress, reflected in a low reading on the KCFSI.
Several factors contribute to market bottoms and tops. One of the most important is investor sentiment. When optimistic about the future, investors are more likely to take on risk and buy equities, which drives up stock prices and creates a market top. When pessimistic about the future, investors are less likely to take on risk and sell equities, which drives down stock prices and creates a market bottom.
Another factor that contributes to market bottoms and tops is interest rates. When interest rates are low, investors are more likely to take on debt and invest in equities, which drives up stock prices and creates a market top. Conversely, when interest rates are high, investors are less likely to take on debt and sell equities, which drives down stock prices and creates a market bottom.
Using the Kansas City Financial Stress Index (KCFSI) to Identify Market Turning Points
The KCFSI can also be used to identify market turning points. A turning point is a change in the trend of a financial market, and it can be a sign of a market bottom or top. The KCFSI can be used to identify market turning points by looking for changes in the level of financial market stress. If the stress level is rising, this is a sign that a market top is approaching. However, extreme readings, as shown above, always indicate an imminent bottom, and vice versa.
Of course, other factors contribute to market bottoms and tops, but the KCFSI is a good starting point for anyone looking to understand the underlying drivers of financial market stress. The KCFSI is a valuable tool for investors and market observers. It provides a comprehensive view of financial market stress and effectively identifies market bottoms and tops.
Using the KCFSI to Buy Stocks at the Right Time: Real Examples
The Kansas City Financial Stress Index (KCFSI) can be a powerful tool for identifying opportune moments to buy stocks, especially during periods of high financial stress when market sentiment is overwhelmingly negative. Here are two real examples of how investors can use the KCFSI to make informed decisions:
Example 1: The 2008 Financial Crisis
During the 2008 financial crisis, the KCFSI reached unprecedented levels, indicating extreme financial stress. Legendary investor Warren Buffett famously advised to “be fearful when others are greedy and greedy when others are fearful.” Following this principle, Buffett made significant investments during the crisis, including his notable purchase of shares in Goldman Sachs and General Electric. By buying when the KCFSI was at its peak, Buffett capitalized on the market’s eventual recovery, demonstrating the effectiveness of using the KCFSI to identify buying opportunities during periods of high stress.
Example 2: The COVID-19 Pandemic
In early 2020, the onset of the COVID-19 pandemic caused a sharp spike in the KCFSI, reflecting heightened financial stress and market volatility. Renowned investor Ray Dalio, founder of Bridgewater Associates, emphasized the importance of diversification and maintaining a long-term perspective during such turbulent times. Investors who followed Dalio’s advice and used the KCFSI to gauge market stress could have identified the market bottom in March 2020. By investing in a diversified portfolio of quality stocks during this period of high stress, they would have benefited from the subsequent market rebound as the global economy began to recover.
These examples illustrate how the KCFSI can serve as a valuable indicator for making strategic investment decisions during periods of financial stress, aligning with the wisdom of some of the best investors of all time.
Other Articles of Interest

Unleashing the Power of Small Dogs Of the Dow

Inductive vs Deductive Analysis: The Clash of Perspectives

Unraveling Crowd Behavior: Deciphering Mass Psychology

Dogs of the Dow 2024: Barking or Ready to Bite?

Zero to Hero: How to Build Wealth from Nothing

The Power of Negative Thinking: How It Robs and Bleeds You

Contrarian Outlook: A Pathway to Breakthrough or Breakdown

Mass Psychology Unveiled: The Hidden Keys to Financial Triumph

Overconfidence Bias: The Investor’s Blind Spot

Panic Selling is also known as capitulation in the markets

Examples of Groupthink: Instances of Collective Decision-Making

Herd Behavior: The Perilous Path to Market Missteps

Disciplined Growth Investors: Path to Maximum Gains

Stock Market Crash Forecast: Ignore the Hype, Focus on the Trend

Mob Mentality Psychology: Outsmart the Masses and Win Big
US Stock Market Fear and Greed Index: Embrace Fear, Shun Joy
