Analyst Predictions: Apple Stock Price Target Revealed
Let’s start looking at the product line before we examine Apple’s price targets.
Apple has already had a significant year with the release of the new iPad Pro and the iPhone SE. Despite challenges posed by the COVID-19 pandemic, Apple is expected to launch more products in 2020. This includes the highly anticipated 5G-enabled iPhones, a new Apple TV, an Apple Watch with sleep-tracking capabilities, and other devices. Apple is also exploring augmented reality technology, with potential plans to incorporate 3D camera sensors into its new iPhones, which could pave the way for an AR headset. The company continues to adapt to remote work arrangements and supply chain disruptions during these uncertain times. Full Story
Apple Stock Price Target
Let’s quickly look at the chart of AAPL and then at some of its products before looking into whether it’s the right time to get in.
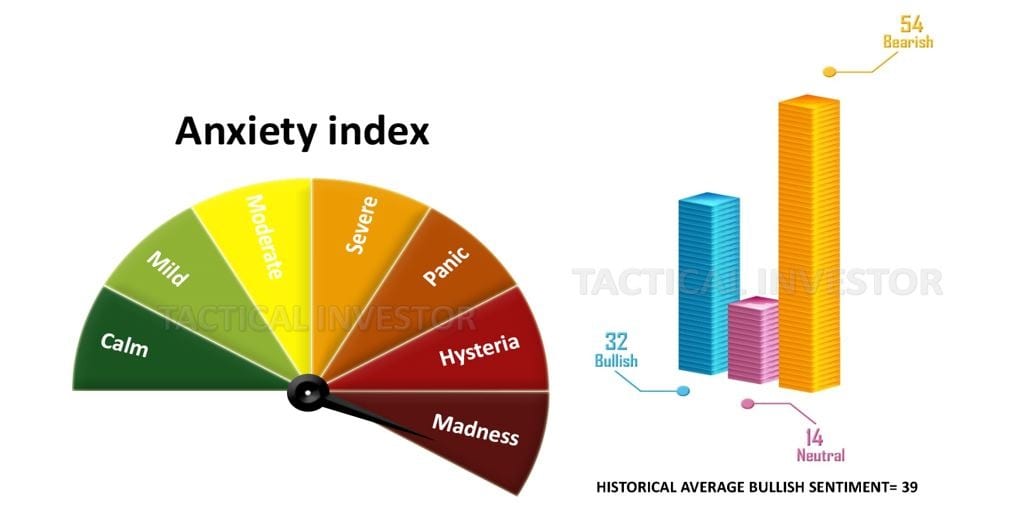
As of April 2020, AAPL is a strong buy, and all sharp pullbacks should be viewed through a bullish lens. In less than 15 months, we expect AAPL to be trading north of 320. A monthly close above 300 should push to a test of the 360 to 390 ranges with a possible overshoot to 450. Hence, astute investors should use the current pandemic-based hysteria to load up on shares of AAPl and other quality companies in the AI sector.
Assessing Apple’s Stock Price Target and Growth Prospects: April 2020 Update
Given the current overreaction to the coronavirus, there is a 70% probability that when the Dow bottoms and reverses course, it could tack on 2200 to 3600 points within ten days. Interim update March 9, 2020

The 1987 crash and 2008 crash fell into the “mother of all buying opportunities” category, but we could get a setup that could blow these setups and create the “father of all opportunities“. Such an event is so rare that it might occur only once during an individual’s lifetime. In the short term, there is no denying the landscape looks like a massacre, but if one is going to focus solely on the short timelines, then the odds of banking huge profits are pretty slim.
Insiders have been using this massive pullback to purchase shares, and one way to measure the intensity of their buying is to check the sell-to-buy ratio. Any reading of 2.00 is considered normal, and below 0.90 is considered exceptionally bullish. So what do you think the current ratio is; well, it’s at a mind-numbing 0.35, which means these guys are backing up the truck and purchasing shares.
Today’s readings indicate a significant level of insider buying activity. Vickers’ benchmark NYSE/ASE One-Week Sell/Buy Ratio stands at 0.33, suggesting a strong inclination towards buying. The Total one-week reading is 0.35, further reinforcing the trend of insiders devouring shares. This behaviour is reminiscent of past instances such as late-December 2018, early 2016, and late 2008/early 2009, when insiders seized the opportunity to buy stocks during market corrections and economic downturns. The current insider activity implies that today’s market presents a similar opportune moment for investors. https://yhoo.it/2TV0cE2
Other Articles of Interest:
BIIB stock Price: Is it time to buy
Stock market crashes timelines
Dow theory no longer relevant-Better Alternative exists
In 1929 the stock market crashed because of


