

Breaking the Silence on How to Read Stock Trends
Updated Nov 2023
True wisdom emerges from history’s lessons, sparing us the painful learning journey through mistakes. Why choose hardship when others’ missteps offer valuable insights? Let’s delve into history and conclude with our latest insights as of Nov 2023.
Before we get into the meat of the article, let’s look at some of the statements we made over the past few weeks. These comments are being extracted from the market update service.

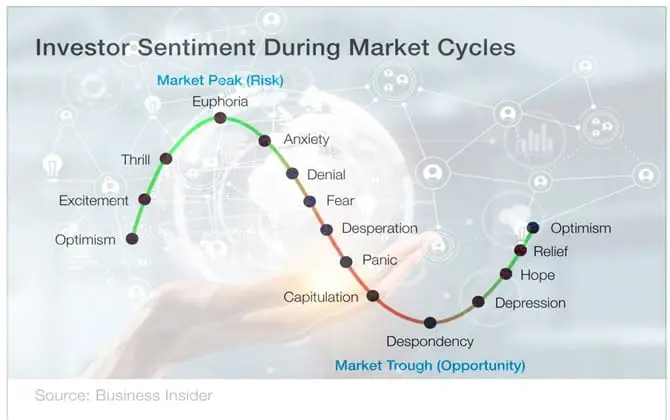
Put your personal feelings aside and understand this simple fact. No bull market has ever ended on a note of fear; it has always ended on a note of extreme joy. Market Update Jan 17, 2020
Since the inception of mass media, the idea has been to stampede the crowd or create a feeling of euphoria, and both conditions are deadly when it comes to investing. However, the new ploy is to keep the masses agitated constantly or uncertain. Why would they do this? When someone is uncertain, it takes longer for them to cling to a given viewpoint; they keep jumping from one camp to another, which is why this bull market has lasted so long.
A sharp pullback is still an outcome we view through a bullish lens. The ideal setup calls for the Dow to trade in the 28,800 to 29,000 range, with a possible overshoot of 29,300. After that, a nice sharp pullback would set the bedrock for a surge to and possibly well past 30k. Market Update Dec 29, 2019
Deciphering the Code of Trend Signals
The best time to buy is when the masses are in a state of disarray, and this usually occurs when it looks like the markets are crashing. The masses are hardwired to view strong pullbacks as the start of a new crash, but most pullbacks are nothing but resting points; the markets use these stops to build up energy for the next upward leg. Tactical investors should hope the market will pull back firmly, giving them a lovely opportunity to open long positions at a discount.
It is also one of the reasons why the small player is generally still sitting on the sidelines. They still don’t know if they should jump in and buy or if shorting the markets is the right course of action; the longer they remain uncertain, the higher this market will trend. Market update Jan 7, 2020
One can immediately spot that the media takes delight in blowing anything out of proportion as it comes down to eyeballs and dollars. The more bombastic the headline, the more attention it will get, even if this attention is for a few minutes. Ultimately, we don’t have news today; we have weaponized gossip.

Stock Trends and The Coronavirus Factor
The Coronavirus issue will be blown out of proportion and made to look like the mother of all pandemics. We are seeing individuals not qualified to make projections on the rate at which this virus will spread, stating that millions will be affected.
Now people are being checked with thermometers to see if their temp is above average, and an above-normal temperature has become the litmus test for the Coronavirus; voodoo science at its best. This is one of the most retarded medical tests of all time, but no one seems to notice; a real-life depiction of “Pluto’s Allegory of the Cave”.
According to the CDC, during the 2018-2019 flu season, approximately 35.5 million people fell ill with influenza. Of these cases, around 16.5 million individuals sought medical care, resulting in 490,600 hospitalizations and 34,200 deaths. These figures are comparable to the estimated number of flu-related illnesses during the 2012-2013 season, where around 34 million people experienced symptomatic influenza. More details
In comparison to the flu virus, the Coronavirus has caused a minimal amount of damage. Yet, it has received 100 more coverage than the flu virus, which resulted in 34.200 deaths (and only US data is being used).
Tobacco use is responsible for over 7 million deaths annually worldwide. If the current global smoking patterns persist, it is projected that over 8 million people will die each year from tobacco-related diseases by 2030. More details
Many masks worn by individuals offer limited effectiveness against viruses, and even masks that provide protection must be worn correctly to be effective. More details. According to other experts, masks are considered useless in preventing virus transmission as the virus can be spread through the eyes. More details
The crucial point we’re emphasizing isn’t about categorizing COVID as good or bad or debating its contagious nature. Instead, it’s a simple truth: succumbing to panic erases rational thinking. What ensues is the rapid growth of fear, a perilous force that, once rooted, spreads uncontrollably like a wild and dangerous weed. In the realm of markets, this is particularly hazardous, as history demonstrates in events like the 1987 crash, the dot-com bubble burst, the 2008 financial crisis, and the recent COVID-related market downturn in 2020.
Analyzing it from this perspective, it becomes evident that the key to success in markets lies in doing the opposite of the masses. However, here’s the critical caveat: patience is paramount. It’s crucial to wait until fear levels surge, measured by bearish readings. Any reading surpassing 50 signals stress, while anything above 55 indicates extreme stress. In these moments, one should decisively dive in and commence aggressive purchasing. This approach has proven to be a strategic counterbalance to the damaging effects of mass panic.
How to Read Stock Trends: 2020 Update
There is a 75% chance that the markets will experience at least one strong pullback this year; it would be foolhardy to attempt to predict the exact date, though it would be ideal if this event took place during the 1st quarter. Market Update Feb 20, 2020
This correction is taking place in the ideal timeline, so it will lead to a spectacular rally when it ends. Those waiting for the crosswinds to subside will (as always) be left holding a can with rotting worms.
The masses beg for an opportunity to buy stocks at a lower price; when that opportunity arises, they panic, stating that they need to wait for things to improve before jumping in again. And so they wait, and when things finally get better, they notice that the price of everything they want to buy is higher than before, and so starts the next stage of sorrow.
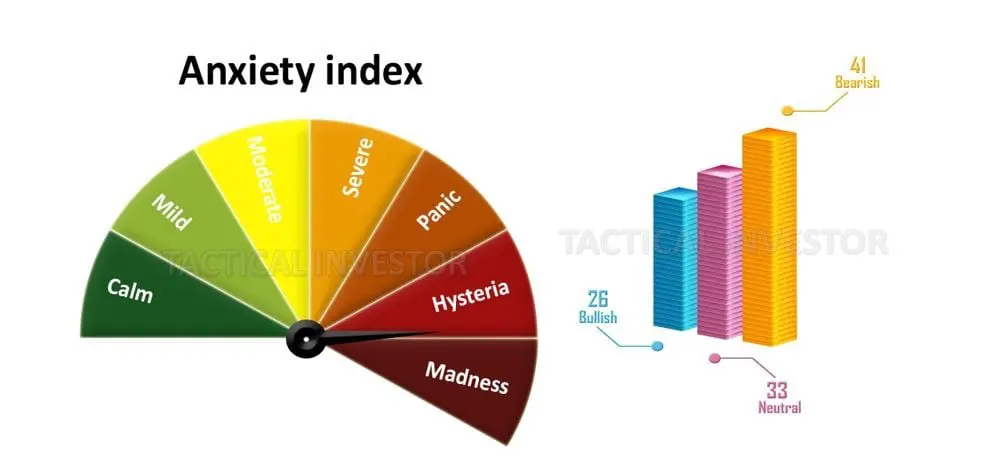
Notice anything odd above in terms of market sentiment. The markets have sold off, so one would expect bearish readings to soar north off 55. Instead, while they have risen, they are only at 41. What’s very interesting is that the number of individuals in the neutral camp is holding steady at 33, and this confirms that the masses are still uncertain, which means that the rebound from this correction will push the market to new highs.
Unveiling the Mystery: Mastering the Art of Reading Stock Trends
This market has yet to experience the “feeding frenzy stage,” we expect the action to be twice as decisive as the current downward action gripping the markets. We hope the Dow to experience upward moves ranging from 500 to 1000 points several times before the market even comes close to hitting a massive long-term top.
The needle on the anxiety gauge has swept deep into the hysteria zone extremely rapidly, indicating the crowd is one stop from moving into a zone that, until now, we did not create “the madness zone”. If the gauge moves into this zone, we could have an event that will become known as the “father of all buying events.”
Decoding the Modus Operandi of the Shadow Players
These big players have an enormous amount of money- truly vast sums. Just before the Market took off after COVID, their wealth grew to unimaginable levels. This was mainly due to their almost unlimited access to a vast pool of money. After COVID, they amassed such an enormous amount of funds that they had the power to affect short-term market trends significantly. This is what triggered the era of extreme market movements.
We’ve been closely watching data from Blackpools, and it confirms our theory that these major players intentionally manipulate the markets. This manipulation leads to extreme swings in both overbought and oversold conditions.
Let’s take ALB as an example. It’s been in oversold territory since May 2023. These influential players, who have a lot of cash at their disposal, don’t just buy all at once in the 190 to 220 range; doing so would essentially make them the Market. Instead, they strategically purchase shares at different price levels like 220, 210, 200, 190, 180, 150, 130, 120, and so on. Once these major players finish their purchases, the resulting market reversals are quite significant.
With their financial resources surging after the COVID-19 crash, the strategy of stretching market cycles will probably persist. If you examine the number of sectors and stocks that are currently in the midst of prolonged cycles, the disparities compared to the pre-COVID period are truly astounding.
It’s crucial to recognise that these major players aren’t always fixated on securing the absolute best price. Their primary objective is to deploy their capital efficiently. They possess a well-defined vision of where a stock is likely to trade 12 to 24 months down the road. Therefore, in the case of a stock like ALB, whether it’s at 120 or 220 doesn’t greatly concern them. Indeed, a 20% price movement is highly significant when you have substantial resources at your disposal. It’s a safe bet that they will achieve, at the very least, a 20% gain from their average entry price. However, in most cases, they often secure well over 60% in gains.
The same strategy or tactic is being deployed with KALU, where, despite outperforming earnings expectations, the stock went through a noticeable pullback. KALU reported quarterly earnings of $0.46 per share, surpassing the Zacks Consensus Estimate of $0.40 per share, marking a substantial earnings surprise of 15%. In the previous quarter, KALU had delivered a remarkable earnings surprise of 180% by reporting earnings of $1.26 per share compared to the expected $0.45.
Stock Market Trends Outlook for 2023 to 2024
The Russell 2000 lacked the momentum to revisit the 2003 range, and the weekly MACDs suggest it’s poised to align with other indices like the NDX, SPY, and the Dow. If there’s a weekly close at or below 1830, a test of the 1700 range is probably likely. Market update September 7, 2023
It closed below 1830 on a weekly basis in the last week of September and traded as low as 1709, which technically fulfils the minimum downside targets. However, there is a reasonable possibility that it might experience another downward spike before reaching a bottom. The most apparent targets are within the range of 1620 to 1650. Market Update October 12, 2023
The Russell traded as low as 1633, aligning with the earlier outlook. However, with the rapid surge in bullish sentiment this week, marking a 100% increase from last week’s readings (current reading is 44, up from 22), there’s a possibility that the Russell could retest its lows. The same holds true for the NDX (Nasdaq 100), which could potentially drop to the 13,600 to 13,800 range.
If this scenario unfolds, whether it’s the Russell, the NDX, or the SPX, it should be viewed as a buying opportunity.
Bearish readings have finally crossed the 50 mark, with the most recent reading standing at 52. Ideally, we would have preferred to see them reach the 55 level, but one can’t always get what they wish for. While bullish readings have not dropped below 20, a considerable portion of participants has shifted to the Neutral category. The Neutral camp is where those who are uncertain about the future tend to gather.
The current ratio looks like this: Bears: 52, Bulls: 22, and Neutrals: 26. In total, 78 percent of traders fall into the bearish or uncertain categories, as we had previously noted in the interim update posted on Friday, November 3, in the forum. As indicated in that update, the path of least resistance now points upward. Market Update Nov 5, 2023
It seems that the markets have reached a bottom, especially when considering the most recent bearish sentiment reading, which we’ve just calculated, registering at 52.00. Unless an unforeseen black swan event disrupts the status quo, the path of least resistance is now pointed upward.
The weekly charts show that the markets are in an extremely oversold condition, aligning with sentiment analysis. Ideally, we would have preferred the bearish sentiment to surge to 55, but as the saying goes, you don’t always get what you want. This situation highlights the wisdom of buying when fear is prevalent in the Market. We got into many great plays during the Market’s sell-off, and many of them have already yielded substantial gains. Examples of these successful plays include stocks like PXD, ASML, UPW, CLF, and more.
Unless an unexpected black swan event occurs, it’s advisable to view pullbacks as opportunities akin to reuniting with a lost lover.

Enrich Your Knowledge: Articles Worth Checking Out


Mind Control Techniques: Mastering Market Dynamics for Success
