
Leading Economic Indicators: Unveiling the Secrets of the Stock Market
Updated Feb 27, 2024
Imagine navigating the vast ocean of the global economy, where the waves of market sentiment and the winds of supply and demand constantly change. In this ever-shifting environment, the Baltic Dry Index (BDI) stands as a lighthouse, providing invaluable insights into the underlying conditions of international trade. Much like the way copper, with its widespread applications in various industries, has earned the moniker ‘Dr. For its ability to diagnose the health of the global economy, the BDI serves as a leading economic indicator, signalling the future direction of economic growth and trade.
The BDI is a composite of rates for shipping various raw materials and is often seen as a pure reflection of shipping services’ supply and demand dynamics. When the index rises, it suggests that demand for shipping capacity is increasing, which often correlates with a strengthening global economy. Conversely, a falling BDI could indicate slow trade and economic activity. This index is unadulterated by speculator sentiment, offering a clear view of the actual demand for shipping, unlike stock or bond markets that can be influenced by monetary policy and investor behaviour.
On the other hand, copper is a fundamental material used in construction, electronics, and power generation. Its price is sensitive to changes in economic trends; a rise in copper prices can suggest strong demand and robust financial health, while a decline might indicate the opposite. Despite tight physical markets, the recent fluctuations in copper prices reflect the complex interplay of investor sentiment and real-world demand.
When the BDI and copper prices are analyzed with mass psychology and technical analysis, they can become powerful tools for investors. Mass psychology helps to understand the market’s mood, whether overly optimistic (greedy) or pessimistically fearful. With its charts and patterns, the technical analysis visually represents market trends and sentiment. Together, they can help investors discern when the market is ripe for buying stocks or when caution is warranted.
For instance, a rising BDI alongside increasing copper prices, where mass psychology does not indicate an overheated market, could be a green light for investors to consider entering the stock market. Conversely, declining trends in these indicators might suggest a period of caution, where holding off on stock purchases could be wise.
The dance between these indicators and market psychology is intricate and fascinating. They are not infallible crystal balls, but when combined, they offer a fascinating tapestry of clues that can guide investors through the tumultuous seas of the stock market. Understanding these signals and the stories they tell can be the difference between sailing smoothly towards profitable horizons or navigating through stormy financial waters.
Navigating the Baltic Index: Insights for 2024
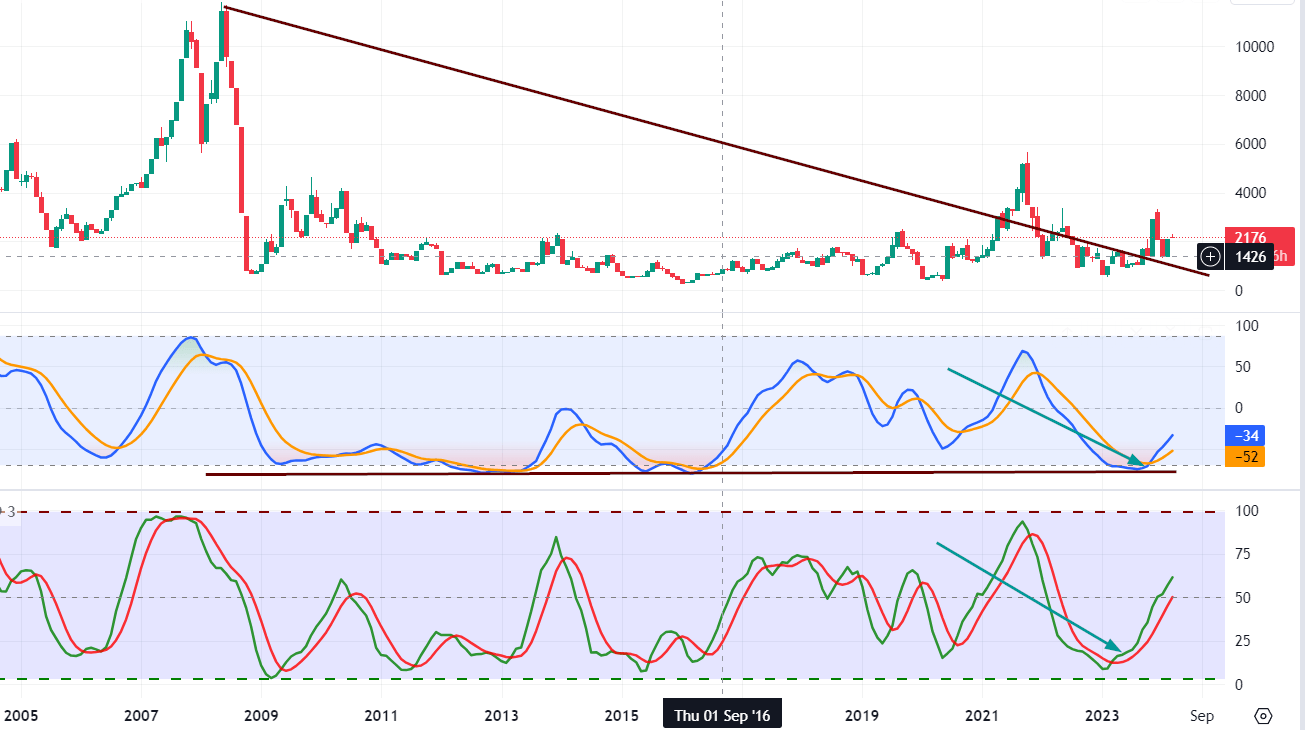
The monthly charts reveal that the Baltic Dry Index (BDI) is currently trading in extremely highly oversold zones. This alone makes it an attractive prospect for long-term investment. However, it’s important to note that the market outlook will remain volatile until the BDI achieves a monthly close at or above 2550. Once it surpasses this threshold (the higher, the better), it will set the stage for a potential rise to the 3900 to 4150 range.
This trend suggests that the shipping transportation sector, among others, could be a promising area for long-term investment. Some notable stocks in this sector include SBLK, DSX, NMM, DNK, and EGLE. Using market pullbacks as opportunities to add to your position would be prudent. Conversely, when the BDI enters the overbought range, it might be wise to consider taking some profits off the table.
Why These Indicators Are Essential for Investors in 2023
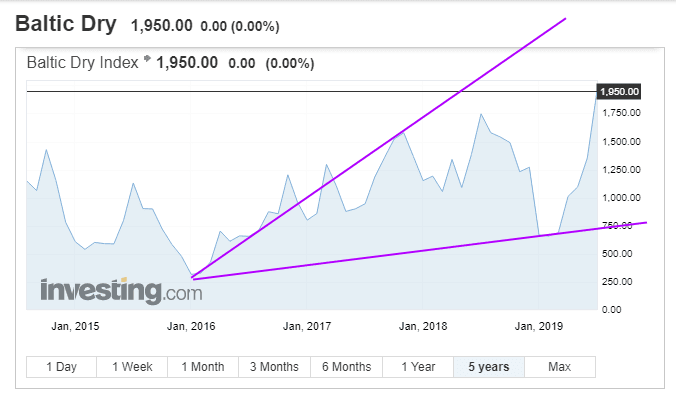
Similarly, the Baltic Dry Index has been used to predict global stock returns, commodity returns, and economic activity. While its record since 2008 has been patchy, the index shows signs of life in 2023. The current pattern indicates the index is gearing up to move to the 3700 to 3900 ranges, with a possible overshoot to 4500.
Using leading economic indicators like Dr Copper and the Baltic Dry Index can provide valuable insight for investors looking to make informed decisions in the stock market. As the world economy continues to evolve in 2023, keeping an eye on these indicators can be a critical tool for success
Overall, understanding the power of leading economic indicators like Dr Copper can be an invaluable tool for investors looking to make intelligent decisions in the stock market. By paying close attention to the price movements of critical indicators, investors can stay ahead of the curve and make well-informed investment decisions.
Dr Copper’s 2022 Highs and the Troubles of Bad Policy Decisions
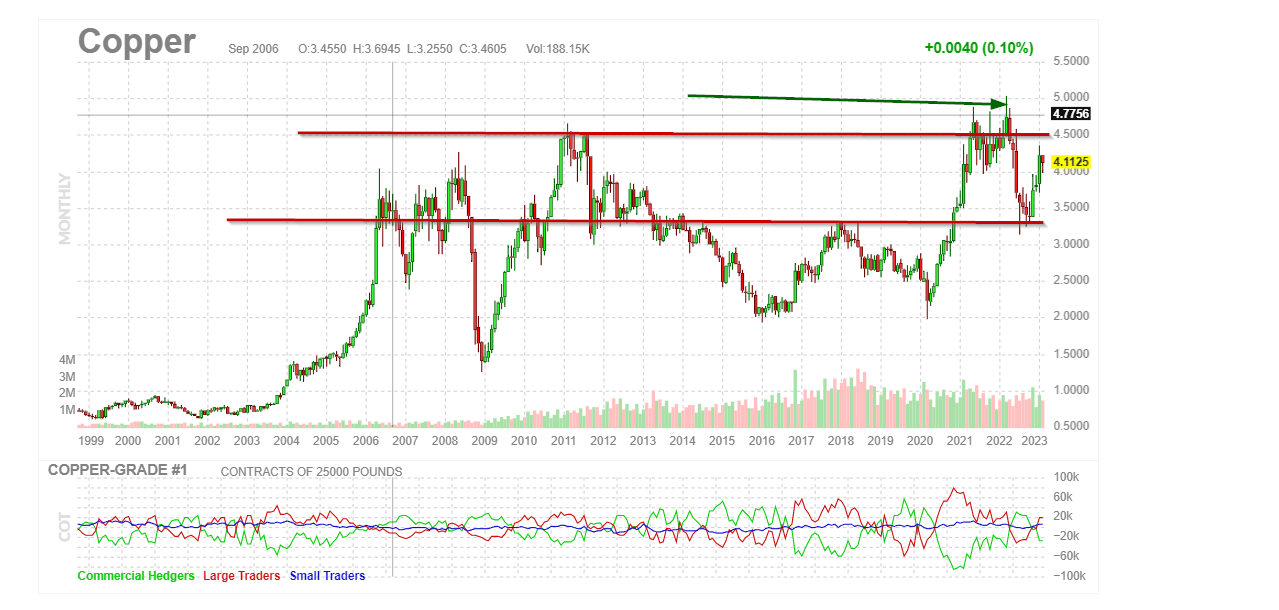
In 2022, copper reached new highs, indicating that the global economy was not in trouble. Instead, the woes were caused by improper political decisions, with the United States being the leader of the pack of “stupid leaders.” Despite a sharp pullback, copper’s support held, and it surged past 4.50 with relative ease, showing that inflation and supply-side issues were the results of bad policies, with President Biden leading the charge.
Dr Copper is now building momentum to trade past 4.50, suggesting that the market will remain range-bound for years due to bad policy decisions. While this range will be perfect for traders, it will be terrible for long-term investors who focus on indices. Market psychology and technical analysis work incredibly well when the markets are range-bound, and this market will be milked for all its worth. The role of leading economic indicators in trading cannot be understated, as they provide insights into the future state of the economy and help traders make informed decisions.
April 2020 Update on Leading Economic Indicators
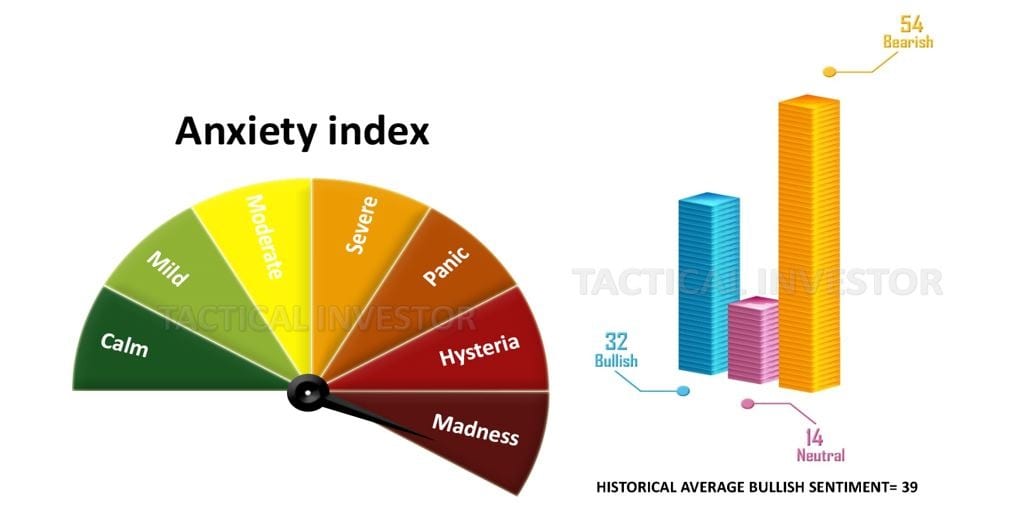
Fear is a fool’s game that one should never play. Succumbing to fear leads to selling at the bottom and buying at the top – a foolish endeavour. Consider the Great Recession; even entering the market early before the Dow bottomed would yield substantial gains today. Panic-driven selling is an opportunity, especially in the age of perpetual QE. Crucially, remember that euphoria wasn’t widespread when this sell-off began.
Selling should only happen in a state of market euphoria. Market downturns offer numerous opportunities. Instead of panicking, create a list of desired stocks. Markets always revert to the mean, and the greater the deviation, the better the opportunity. History supports one market trend – upwards. Resist fear; bullish times await. Stay composed and confident, and anticipate the opportunities on the horizon.
Hysterical Crowd: A Danger for Investors
There is nothing more to add here other than jumping in and buying all the top-notch technology and AI-based companies you can get your hands on. Many of them are almost being given away.
Taking a historical perspective as those who don’t learn from history are doomed to repeat it
What is the Baltic Index saying
The Baltic Dry Index displays encouraging signs of an upcoming upward trend in the intermediate charts. The current pattern is neutral but leaning strongly towards a positive shift, indicating that the index is gaining momentum towards reaching the 3700 to 3900 range, possibly surpassing 4500. A monthly closing above 1950 could lead to a test of the 2900 range. Looking at the long-term perspective, the index is yet to break out, requiring a quarterly closure above 3000 or a monthly closure above 4200 to achieve this. Successful attainment of these levels would turn the long-term outlook bullish. Additionally, copper also exhibits indications of signalling a new bullish trend.
The Power of Dr Copper: Decoding the Economic Message
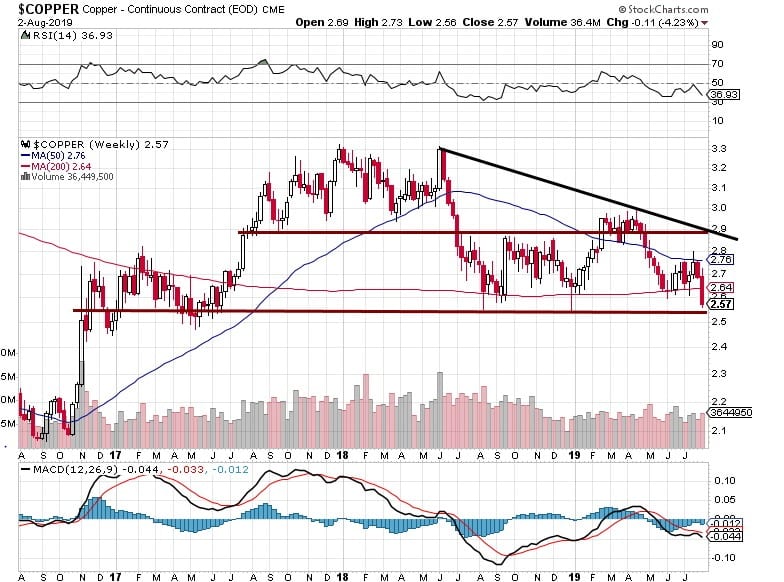
Dr Copper is one of the leading economic indicators, and its price is often seen as a barometer of the global economy’s health. If copper prices rise, it suggests a growing economy as manufacturers increase production to meet demand. On the other hand, falling copper prices indicate a slowdown in economic activity.
The current pattern suggests a bullish signal, with the potential for copper prices to rise to 5.10 within the next 9-12 months. The MACD crossover is also expected to lead to a strong breakout, indicating further upside potential.
These bullish signals indicate that the previous upside targets of 30K for the Dow might be too conservative. However, caution is warranted, and watching how the Dow reacts when it reaches 29K is necessary. It’s essential to stay contrarian and not be swayed by short-term market fluctuations.
Leading Economic Indicators Signal Trouble Ahead
According to a 2011 academic paper, the Baltic Dry Index could predict global stock returns, commodity returns, and global economic activity. Google searches for the term rose significantly from late 2006 to their peak in February 2009. A month before crude oil peaked in July 2008, economist Lutz Kilian created a home-brew index of ocean freight costs and argued that it could be used to spot turns in the global business cycle. The Baltic Dry Index has been a valuable indicator of the health of the worldwide economy, with fluctuations in the index often signalling changes in global trade and economic growth.

The Baltic Dry Index, while once touted as a predictor of global economic activity, has proven to be unreliable in recent years. While it successfully foreshadowed the 2008 slump in the S&P 500, its record since then has been inconsistent. A sharp increase in the index in late 2013 didn’t correspond to any significant improvement in the global economy, and a record low in early 2016 didn’t lead to a crash. Instead, it preceded a bull market that drove the S&P 500 up by almost 33% in two years. As a result, the reliability of the Baltic Dry Index as a predictor of economic trends has come under scrutiny bloomberg.com
The Power of Using Dr Copper and Baltic Dry Index as Leading Economic Indicators
As we move into 2023, investors seek ways to navigate the volatile stock market. One approach is to use leading economic indicators to predict future market trends. Two such indicators are Dr Copper and the Baltic Dry Index.
Dr Copper, as a heavily used commodity in construction and manufacturing, can be an indicator of the global economy’s health. When copper prices are high, it suggests a growing economy; when they decline, it can indicate a slowdown in economic activity. In 2023, the bullish MACD crossover of copper prices is expected to lead to a strong breakout, with copper trading north of 5.20 within the next 9-12 months and possibly as high as 5.50. It could potentially overshoot to the 6.00 to 6.30 range.
Other Stories of Interest

Mind Games: Unmasking Brainwashing Techniques in Institutions & Media

The Gamblers Mindset: The Enigmatic Urge to Embrace Loss

Mass Psychology Mastery: Unleashing Financial Success Secrets

Brain Control: Domination via Pleasure

Yipee Yeah Yipey Yoh: Is Now a Good Time To Buy Bonds

The Perils of Following the Flock: Understanding Sheep Mentality

Psychology of Investing: Escape the Herd, Avoid Financial Destruction

Palladium Metal Price Unveiled: Impact on the Hydrogen Economy

Simplifying the Complex: Understanding Psychology for Dummies

What is Hot Money: Unraveling the Significance and Endurance

Zero to Hero: How to Build Wealth from Nothing

S&P 500 Forecast 2024: Charting Projected Targets

Unraveling Crowd Behavior: Deciphering Mass Psychology

Stock Market Predictions for 2018: Reflecting on Past Insights