Leading Economic Indicators: Unveiling the Secrets of the Stock Market
Dec 10, 2025
Picture the global economy not as a spreadsheet but as a restless ocean, shifting under the pull of unseen forces. Every swell hides intent. Every lull masks pressure. In this vast body of motion, two instruments pierce the fog: the Baltic Dry Index and copper. One measures the pulse of ships moving raw lifeblood across the planet. The other measures the appetite of civilisation itself. When they move, they whisper truths the equity market only admits months later.
Most investors chase headlines. The disciplined ones chase signals. The BDI and copper do not whisper opinions; they reveal demand in its rawest form. No central bank narrative distorts them. No algorithm paints them with sentiment. They are economic seismographs, registering tremors long before markets feel the quake. If you read them well, you stop reacting to the news and begin anticipating the world.
The Baltic Dry Index: The Ocean’s Truth-Teller
The BDI is not an index. It is a confession. It tracks the cost of shipping iron ore, coal, grains, and other base materials that civilisation cannot function without. When the BDI rises, it signals something primal: ships are filling, routes are tightening, supply chains are heating, and industrial demand is accelerating beneath the surface narrative. When it falls, the world’s gears slow. Production softens. Trade breathes shallow.
You cannot fake the BDI. There is no speculative froth, no derivatives-based distortion, no choir of influencers turning it into a carnival. It is a frictionless expression of supply and demand, immune to the theatre of investor emotion. Stock indices may rally on hope or collapse on rumour, but a bulk carrier does not lift anchor unless someone is paying real money to move real cargo to meet real need. The BDI is the purest x-ray of global economic momentum you can find.
Copper reveals another dimension. It has earned its nickname, Dr Copper, because it diagnoses global health with uncanny accuracy. Construction, electronics, energy grids, vehicles, manufacturing—all depend on copper’s circulation. When copper climbs, it signals rising strain in the arteries of industry. When copper weakens, it marks the early retreat of economic appetite.
Yet copper is not as innocent as the BDI. Futures markets inject psychology into their price. Fear, optimism, liquidity imbalances, and speculative waves twist the chart into a map of human emotion layered over physical demand. The tension between real-world scarcity and trader sentiment gives copper a dual soul. This duality makes it invaluable. It is not simply a commodity; it is a psychological mirror.
When Indicators Grow Teeth
On their own, these signals are potent. Combined with mass psychology and technical analysis, they become a weapon. They reveal not just demand but the emotional climate shaping how investors misinterpret that demand.
When the BDI surges, copper strengthens, and mass psychology remains cautious, you have a market out of sync with its own fundamentals. That gap is an opportunity. The disciplined investor enters before the crowd awakens, because the price has not yet caught up with reality.
When the BDI falls, copper deteriorates, and mass psychology turns euphoric, you have a market in denial. That gap is dangerous. Euphoria masks the strain in the system, and the technical structure eventually snaps.
Charts become battlefield maps. Support breaks tell you when sentiment fractures. Parabolic moves warn you when greed is writing checks the economy cannot cash. Divergences between BDI, copper, and equities mark the psychological distortions that precede major turns. Markets do not drift into danger; they walk there slowly, confidently, blindfolded.

The Enigma Beneath the Indicators
None of these tools are fortune-tellers. They are more interesting than that. They are filters—stripping illusions from the data so you can see the economic organism underneath. When you overlay them with crowd psychology, you begin to see the market as a living creature: one that gulps air when demand rises, tenses when uncertainty spreads, and panics when its own emotions trap it.
Most investors misread the dance. They stare at the equity chart, not the current shaping it. They navigate storms by following the screams of other passengers instead of watching the waves themselves. The disciplined investor reads the BDI, copper, sentiment, and technicals as a single integrated system. Not a prediction. Interpretation.
Know these indicators, and you stop drifting with the tide.
You begin steering through it.
Navigating the Baltic Index: Insights for 2024
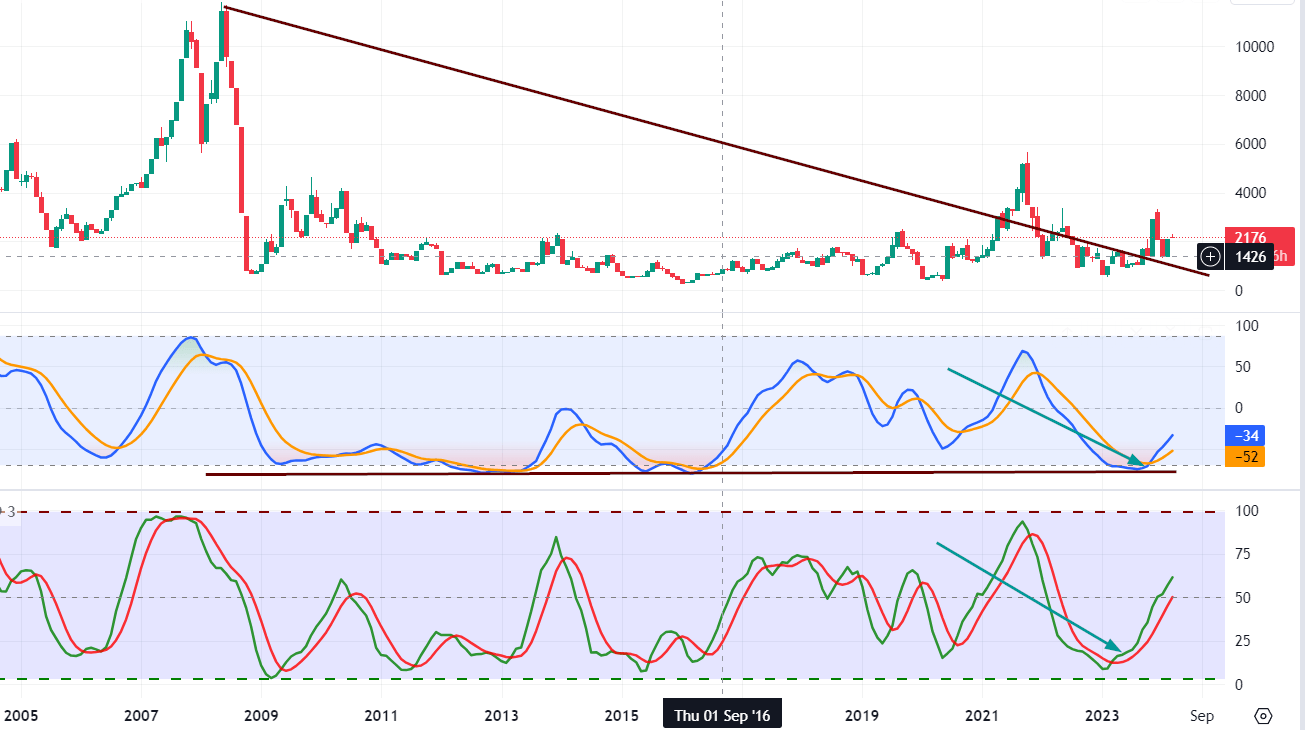
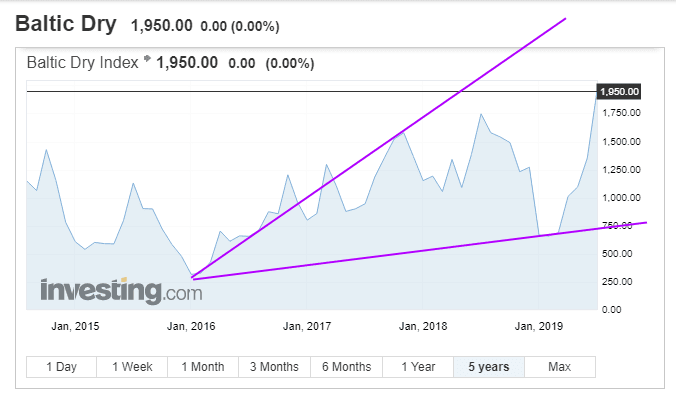
The monthly charts reveal that the Baltic Dry Index (BDI) currently trades in highly oversold zones. This alone makes it an attractive prospect for long-term investment. However, it’s important to note that the market outlook will remain volatile until the BDI achieves a monthly close at or above 2550. Once it surpasses this threshold (the higher, the better), it will set the stage for a potential rise to the 3900 to 4150 range.
This trend suggests that the shipping transportation sector, among others, could be a promising area for long-term investment. Some notable stocks in this sector include SBLK, DSX, NMM, DNK, and EGLE. Using market pullbacks as opportunities to add to your position would be prudent. Conversely, when the BDI enters the overbought range, it might be wise to consider taking some profits off the table.
Why These Indicators Are Essential for Investors in 2023
Similarly, the Baltic Dry Index has been used to predict global stock returns, commodity returns, and economic activity. While its record since 2008 has been patchy, the index shows signs of life in 2023. The current pattern indicates the index is gearing up to move to the 3700 to 3900 range, with a possible overshoot to 4500.
Using leading economic indicators like Dr Copper and the Baltic Dry Index can provide valuable insight for investors looking to make informed decisions in the stock market. As the world economy continues to evolve in 2023, keeping an eye on these indicators can be a critical tool for success
Overall, understanding the power of leading economic indicators like Dr Copper can be invaluable for investors looking to make intelligent decisions in the stock market. By paying close attention to the price movements of critical indicators, investors can stay ahead of the curve and make well-informed investment decisions.
Dr Copper’s 2022 Highs and the Troubles of Bad Policy Decisions
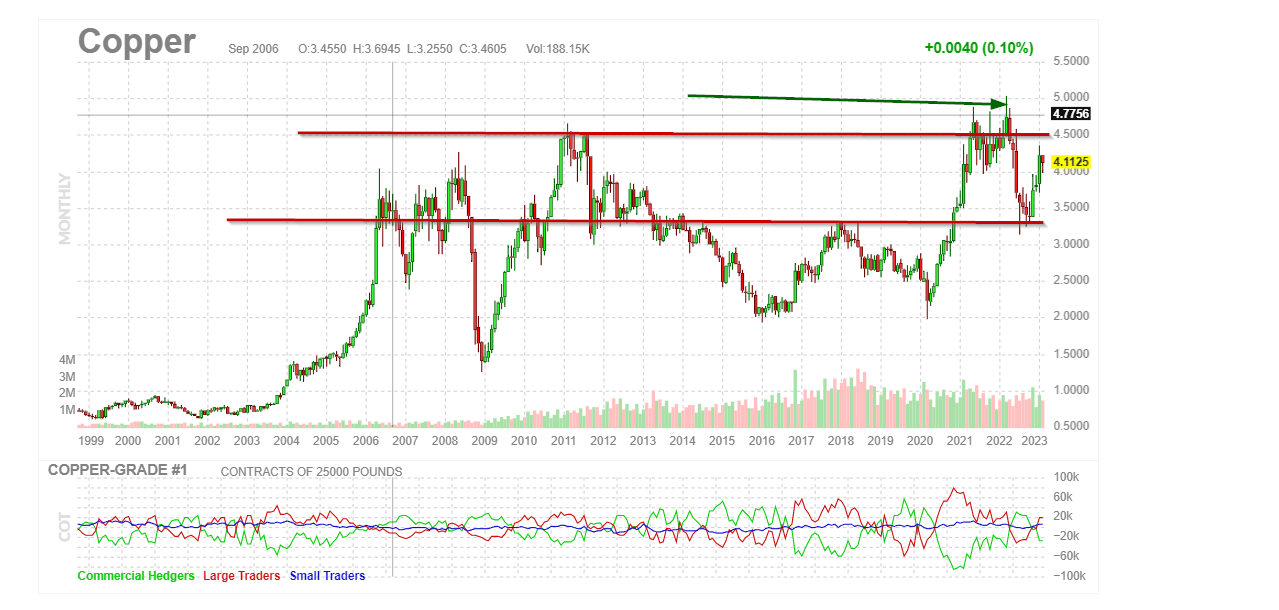
In 2022, copper reached new highs, indicating that the global economy was not in trouble. Instead, the woes were caused by improper political decisions, with the United States leading the pack of “stupid leaders.” Despite a sharp pullback, copper’s support held, and it surged past 4.50 with relative ease, showing that inflation and supply-side issues were the results of bad policies, with President Biden leading the charge.
Dr Copper is now building momentum to trade past 4.50, suggesting that the market will remain range-bound for years due to bad policy decisions. While this range will be perfect for traders, it will be terrible for long-term investors who focus on indices. Market psychology and technical analysis work incredibly well when the markets are range-bound, and this market will be milked for all its worth. The role of leading economic indicators in trading cannot be understated, as they provide insights into the future state of the economy and help traders make informed decisions.

April 2020 Update on Leading Economic Indicators
Fear is a fool’s game that one should never play. Succumbing to fear leads to selling at the bottom and buying at the top – a foolish endeavour. Consider the Great Recession; even entering the market early, before the Dow bottomed, would yield substantial gains today. Panic-driven selling is an opportunity, especially in the age of perpetual QE. Crucially, remember that euphoria wasn’t widespread when this sell-off began.
Selling should only happen in a state of market euphoria. Market downturns offer numerous opportunities. Instead of panicking, create a list of desired stocks. Markets always revert to the mean; the more significant the deviation, the better the chance. History supports one market trend – upwards. Resist fear; bullish times await. Stay composed and confident, and anticipate the opportunities on the horizon.
Taking a historical perspective, as those who don’t learn from history are doomed to repeat it
What is the Baltic Index saying
The Baltic Dry Index displays encouraging signs of an upward trend in the intermediate charts. The current pattern is neutral but leaning strongly towards a positive shift, indicating that the index is gaining momentum towards reaching the 3700 to 3900 range, possibly surpassing 4500. A monthly closing above 1950 could lead to a test of the 2900 range. Looking at the long-term perspective, the index is yet to break out, requiring a quarterly closure above 3000 or a monthly closure above 4200 to achieve this. Successful attainment of these levels would turn the long-term outlook bullish. Additionally, copper also exhibits indications of signalling a new bullish trend.
The Power of Dr Copper: Decoding the Economic Message
Dr Copper is one of the leading economic indicators, and its price is often seen as a barometer of the global economy’s health. If copper prices rise, it suggests a growing economy as manufacturers increase production to meet demand. On the other hand, falling copper prices indicate a slowdown in economic activity.
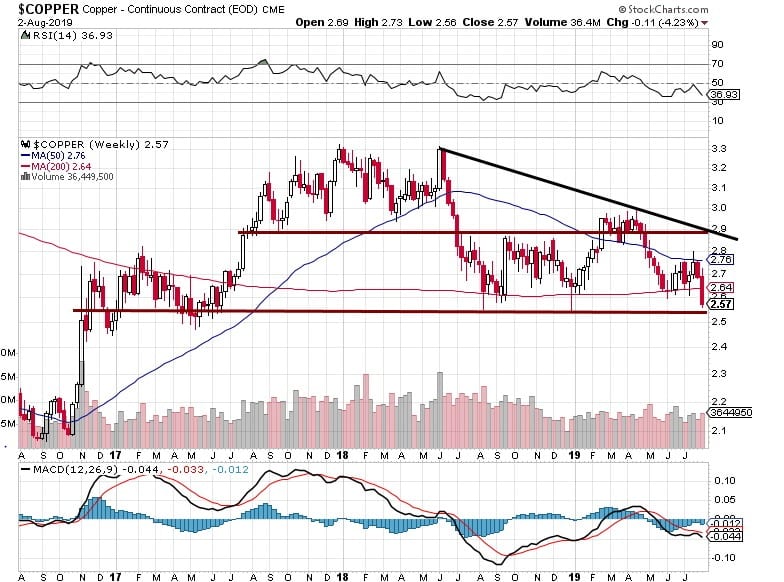
The current pattern suggests a bullish signal, with the potential for copper prices to rise to 5.10 within the next 9-12 months. The MACD crossover is also expected to lead to a strong breakout, indicating further upside potential.
These bullish signals indicate that the previous upside targets of 30K for the Dow might be too conservative. However, caution is warranted, and watching how the Dow reacts when it reaches 29K is necessary. It’s essential to stay contrarian and not be swayed by short-term market fluctuations.

The Power of Using Dr Copper and the Baltic Dry Index as Leading Economic Indicators
As we move into 2023, investors seek ways to navigate the volatile stock market. One approach is to use leading economic indicators to predict future market trends. Two such indicators are Dr Copper and the Baltic Dry Index.
Dr Copper, a heavily used commodity in construction and manufacturing, can be an indicator of the global economy’s health. When copper prices are high, they suggest a growing economy; when they decline, they can indicate a slowdown in economic activity. In 2023, the bullish MACD crossover of copper prices is expected to lead to a strong breakout, with copper trading north of 5.20 within the next 9-12 months and possibly as high as 5.50. It could potentially overshoot to the 6.00 to 6.30 range.