
Best Dividend ETF: Is There Such A Thing
Before it to the meat of this article, one thing most novice investors forget is that timing is key to everything. We are not talking about timing the markets to perfection, but timing the markets based on mass sentiment. In other words one should know what is the best time to buy and or sell based on what the crowd is doing. For example, the crowd’s reaction to the coronavirus pandemic will one day be “labelled” as extreme and many that dumped their stocks and ETF’s will rue that day for many years to come.
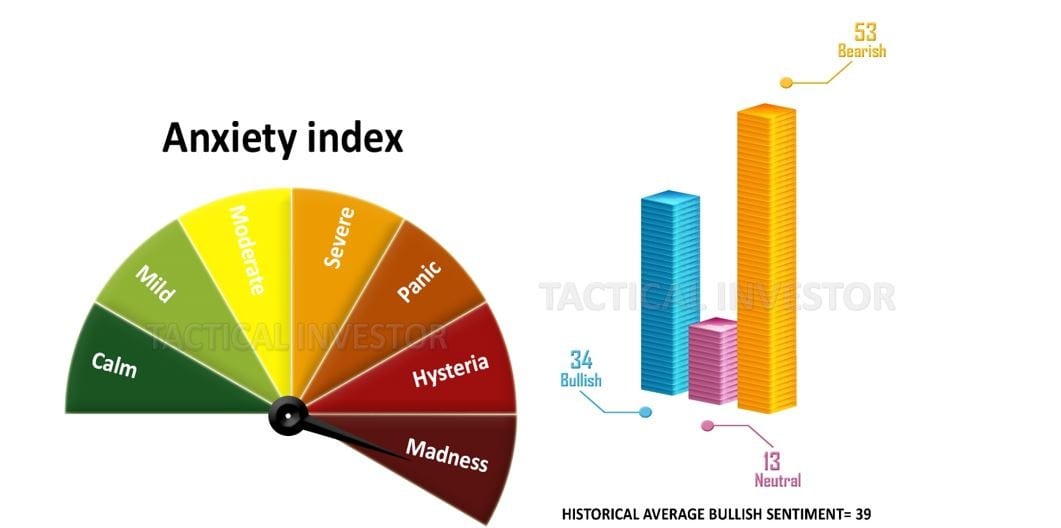
As indicated by the data above, the masses are in a state of disarray and from a long term perspective, this is the best time to buy stocks and ETF’s. When there is blood flowing on the streets the astute investor backs the truck up and starts to load it. We will discuss the coronavirus pandemic and the coming buying opportunity further into this article.
Best Dividend ETF: Is There Such A Thing
Well before we get into the meat of the debate, let’s look at what some so-called top-notch sites are claiming. Investopedia lists three ETF’s that are supposedly the Best Dividend ETF’s to get into. The three are ONEQ, YLCO, and TDIV
ONEQ

It pays only 1.8% and now that the Fed has unleashed the flood gates of hell in terms of hot money, this paltry sum will amount to nothing after inflation
TDIV
This second top-notch recommendation only yields 2.32%, yes, you could do a lot with this money. At this rate, Investopedia is turning out to be a very big disappointment as monkey’s with darts could probably provide better returns than the experts at Investopedia.
YLCO
Okay, this chap yields 3.62% and it falls into the category of barely acceptable. If this is what they call the best dividend ETF’s we would hate to see their worst candidates. You would probably have to pay the company a dividend for purchasing the ETF’s that make it to that list.
The balance also suggested some doozers, we won’t bother going through that list as this dealing with the above three was already an exercise in futility.
So Can The Tactical Investor Do Better?
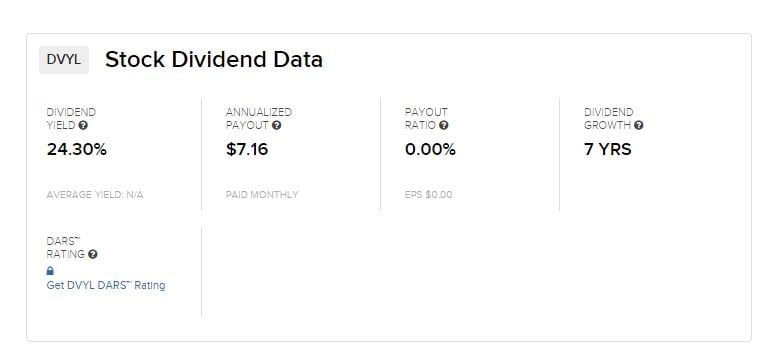
Yes, I think, so let’s look at one candidate. DVYL. Immediately dividend investors will claim oh my its a leveraged ETF. That it is, but the chap pays a whopping 24.3% according to dividend.com and it has paid the dividend for 7 years, which is not a bad history. It’s not going to make it to the dividend champions list, but those champions won’t pay anything close to what this does.
While this play carries a risk there are many ways to mitigate the risk, and one should understand something about mass psychology, technical analysis and portfolio management as all our imperative skills one should master if one wants to become a successful investor.
The investment seeks to replicate, net of expenses, the monthly compounded 2x leveraged performance of the Dow Jones U.S. Select Dividend IndexSM. The index represents the top U.S. stocks as measured by dividend yield, selected annually and subject to screening and buffering criteria. Yahoo
A huge buying opportunity in the making due to coronavirus pandemic Hysteria
To put things into perspective, consider this: If cancer were a virus, it would be one of the most lethal viruses of all time, yet no one blinks that we lose 9.6 million people a year to this insidious disease. Until mass-scale testing is underway and the data is broken down into categories such as age group and other pre-existing conditions, all the massive death projections experts are issuing amount to faulty science.
It appears that the only course of action on the table is to give in to panic and flee for the heels. Well, that’s true if you are part of the herd; such action brings short term relief at the expense of monumentally large gains for the long-term player. Nobody knows the inner workings of a company better than the insiders and these chaps are doing something that can only be described as unprecedented, further confirming that this sell-off represents opportunity instead of a disaster. We will finish tabulating the latest batch of sentiment data tomorrow and another update will be sent within 48 hours if not sooner
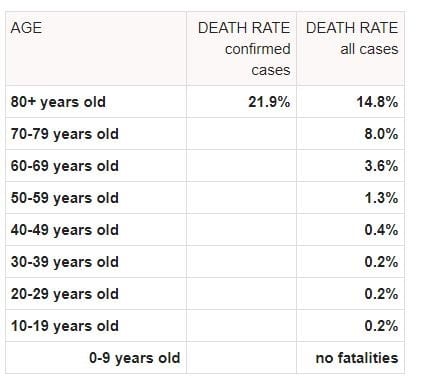
Mortality rates as indicated by the table above are highest amongst the elderly. In individuals aged below 40, it’s only 0.2 and even individuals in the 50’s only have a mortality rate of 1.3%. Furthermore, one’s overall health plays a huge role in determining the mortality rate.
Insiders are extremely bullish on the longer-term prospects of this market
The 1987 crash and 2008 crash fell into the category of the “mother of all buying opportunities“, but we could get a setup that could blow these setups and create the “father of all opportunities“. Such an event is so rare that it might occur only once during an individuals lifetime. In the short term, there is no denying the landscape looks like a massacre, but if one is going to focus solely on the short timelines, then the odds of banking huge profits are quite slim.
Insiders have been using this massive pullback to purchase shares, and one way to measure the intensity of their buying is to check the sell to buy ratio. Any reading 2.00 is considered normal, and below 0.90 is considered as exceptionally bullish. So what do you think the current ratio is; well, it’s at a mind-numbing 0.35, which means these guys are backing up the truck and purchasing shares.
So what are the readings today? Based on very heavy transaction volume, Vickers’ benchmark NYSE/ASE One-Week Sell/Buy Ratio is 0.33, and the Total one-week reading is 0.35. Insiders are not just buying shares, they are devouring shares. Insiders behaved in a similar fashion in late-December 2018, after stocks crashed on Christmas Eve; in early 2016, when stocks also corrected; and in late 2008/early 2009, at the depths of the Great Recession correction. Those were spectacular times to buy stocks. Insiders seem to be telling us that today offers a similar opportunity. https://yhoo.it/2TV0cE2
Other Articles of Interest
Stock Trends & The Corona Virus Factor (March 14)
Misdirection And Upcoming Trends For 2020 And Beyond (March 13)
Trading The Markets & Investor Sentiment (March 3)
Brain Control: Absolute Control Via Pleasure (Jan 20)
Indoctrination: The Good, The Bad and the Ugly (Jan 15)
Dow Transports Validating Higher Stock Market Prices (Dec 30)
Global Trading Volume is Declining & It’s A Non Event (Dec 20)
Dogs Of The Dow Jones Industrial Average (Dec 10)
Trump Stock Market: Will Impeachment Hearings Derail This Bull (Nov 21)
Negative Thinking: How It Influences The Masses (Nov 15)
Leading Economic Indicators: Finally in Syn With The Stock Market? (Oct 28)
Dow Stock Market Outlook: Time To Dance or Collapse (Oct 25)
What Is Fiat Money: USD Is Prime Example Of Fiat (Oct 13)
Yield Curve Fears As Treasury Yield Curve Inverts (Oct 12)
Current Stock Market Trends: Embrace Strong Deviations (Oct 2)
Market Insights: October Stock Market Crash Update (Oct 1)
BTC Update: Will Bitcoin Continue Trending Higher (Sept 17)
