
Dow Transports Support Dow 30K outlook?
Dec 28. 2024
Dow Transports: The Key to Dow 30K Outlook and a Buyer’s Opportunity
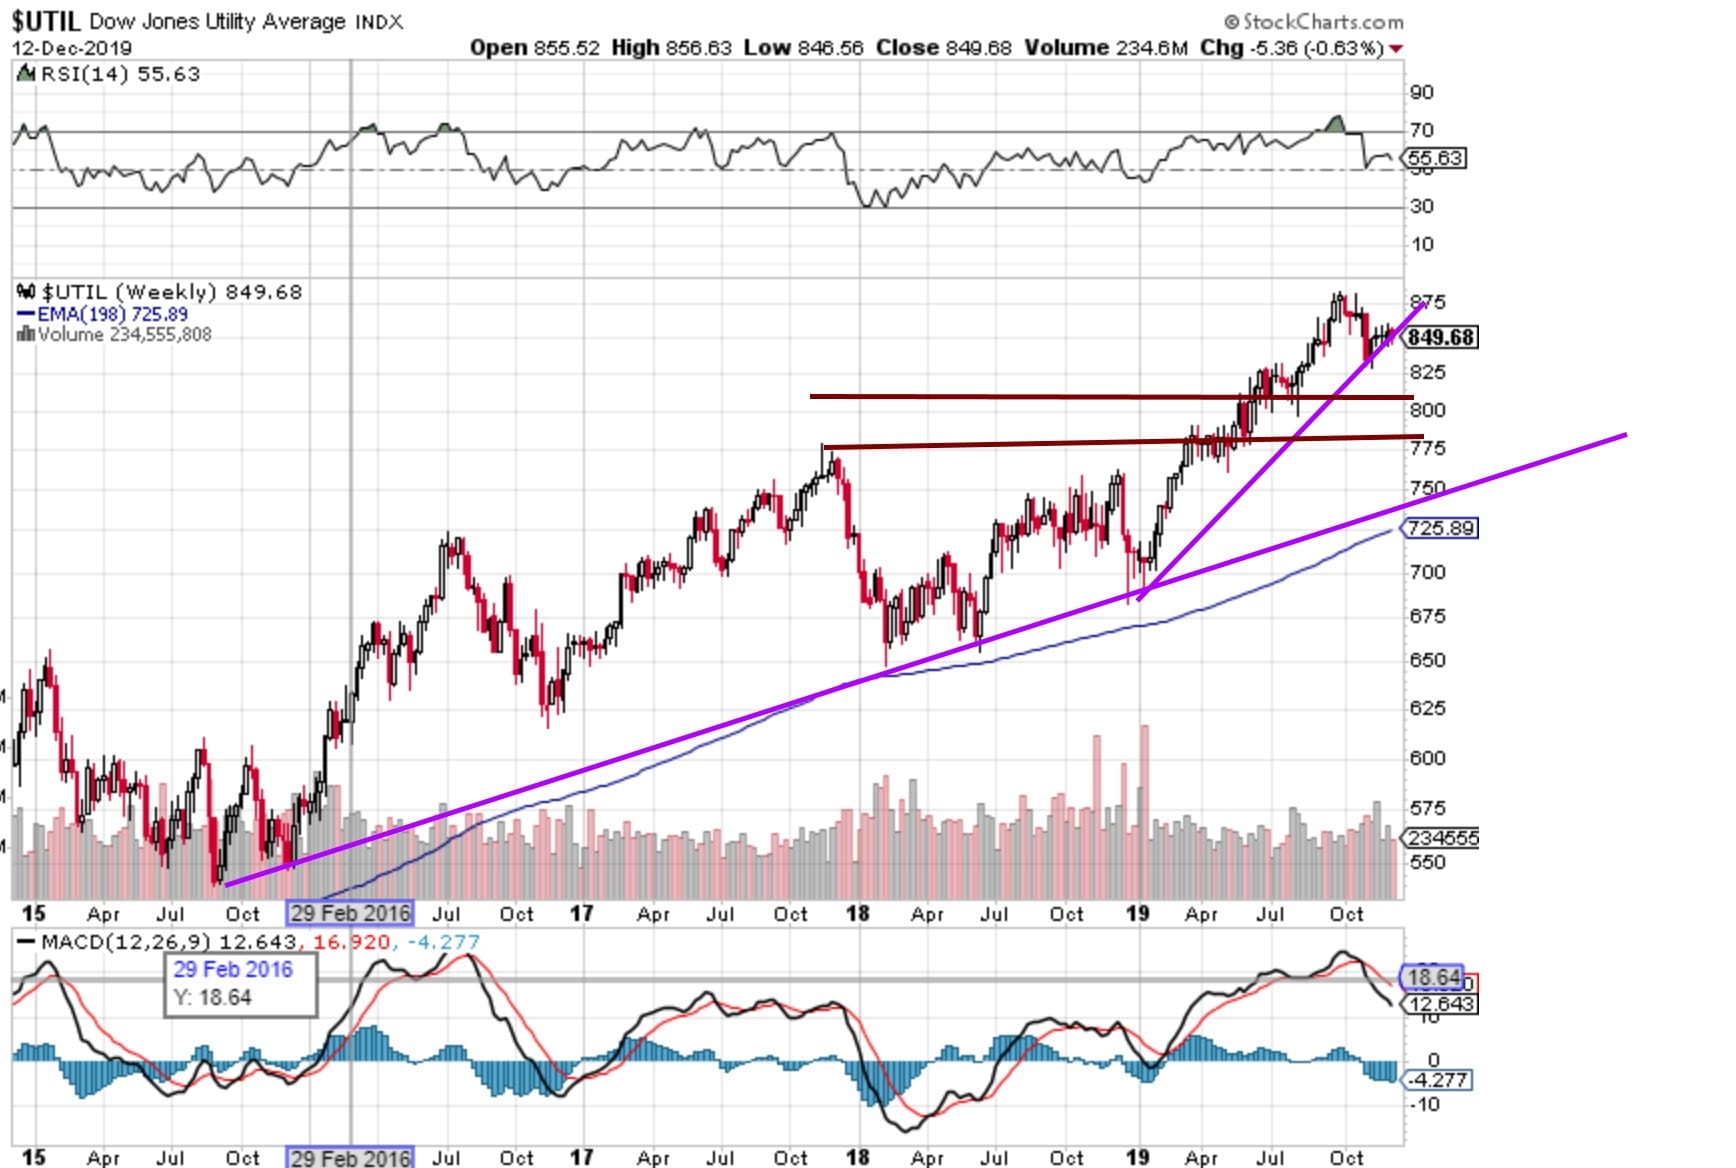
As we highlighted in the previous update, the Dow Utilities are currently in overbought territory, and a pullback is likely imminent. This is not a cause for concern but rather an opportunity—especially since, according to the Tactical Investor’s Dow Theory, if the Utilities experience a significant correction, the Dow is expected to follow suit. The anticipated pullback could bring the Dow Utilities down to the 802-819 range, with the potential for an overshoot to the 765-774 zone. This creates a prime buying opportunity, but only if the broader trend remains intact.
Now, turning to the Dow Transports, a sector that has been trading in oversold territory and is poised for a major rebound. The weekly chart reveals that the Transports are in a strong resistance zone. However, as the monthly charts indicate, this resistance will likely be overcome as the Transports are severely oversold. For a breakout to materialize, the Transports need to close above 11,250 on a monthly basis. Achieving this would confirm the breakout and turn former resistance levels into support, providing the foundation for a potential rally. A successful breakout could push the Transports up by as much as 1,800 to 2,400 points, further supporting the Dow’s upward trajectory.
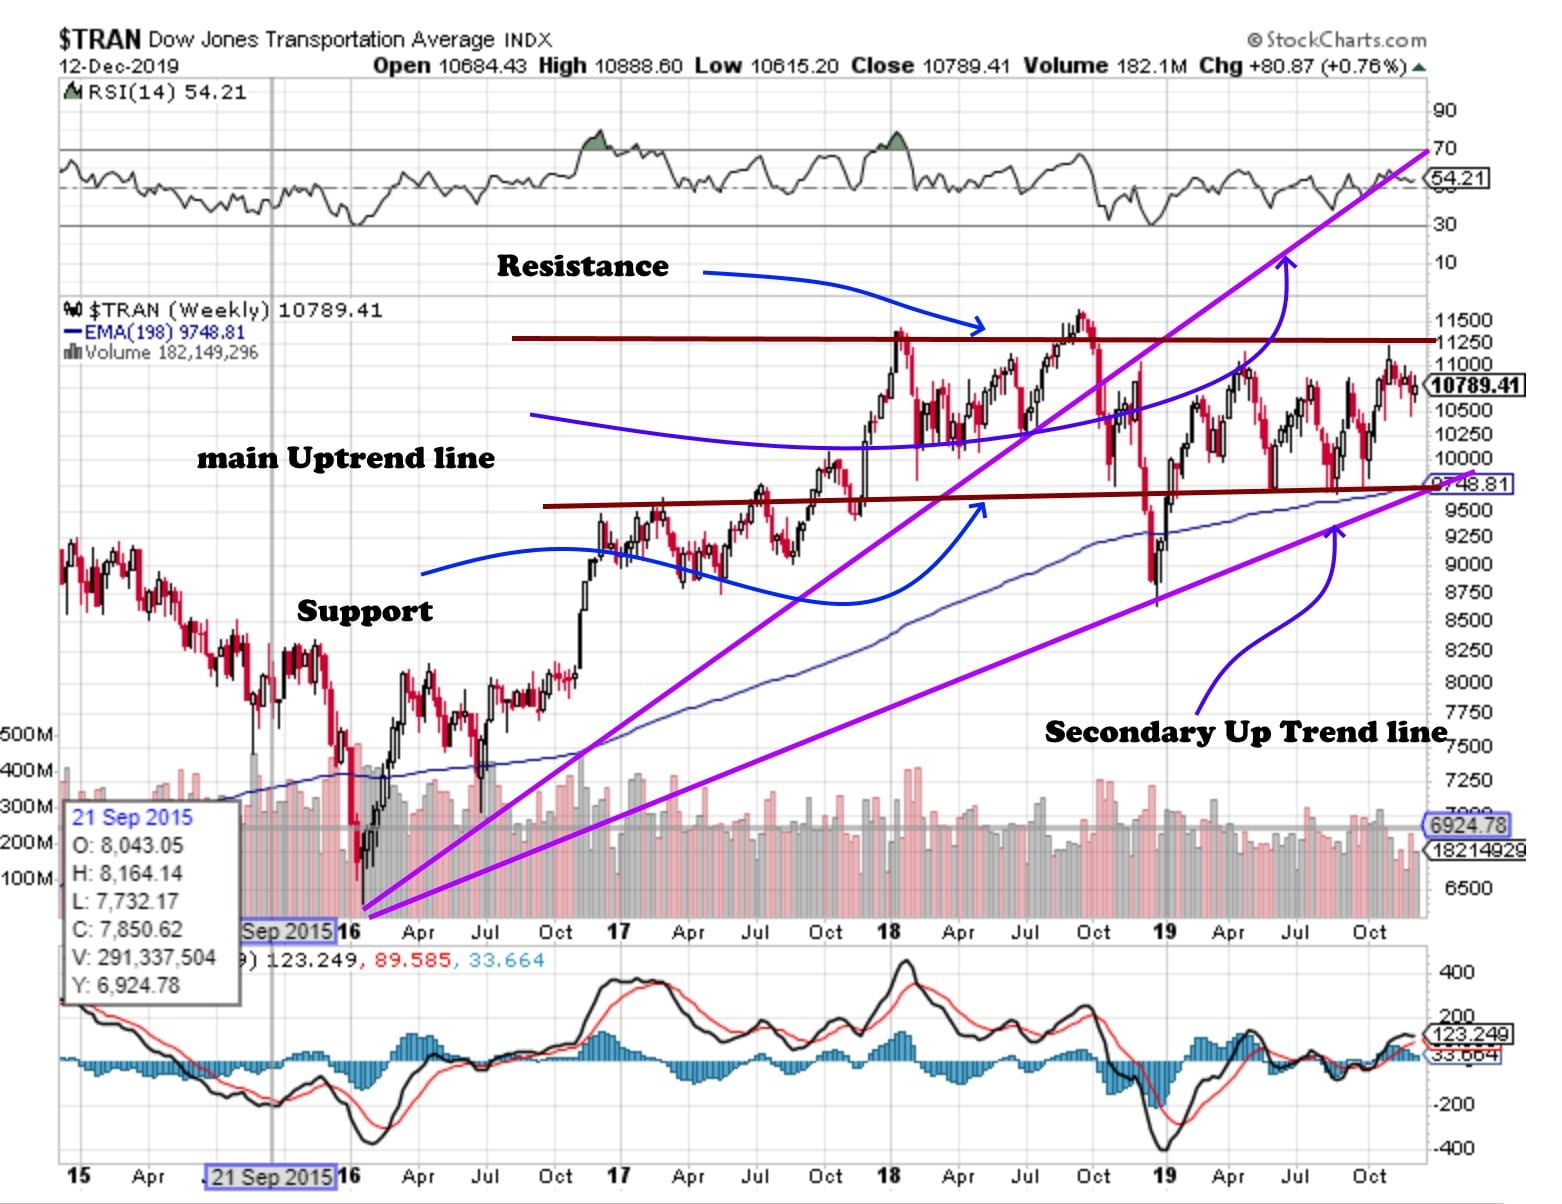
If the Transports break through this key resistance zone, they will validate the bullish Dow 30K outlook and signal that the broader market remains in a strong uptrend. Despite the pullbacks in certain sectors, the trend shows no signs of weakness. Any dips in the market should be viewed as potential buying opportunities, and a breakout in the transport sector would further confirm that the rally is far from over. Therefore, maintaining a bullish stance remains the wisest course of action, as the path to Dow 30K remains very much intact.

Transportation Sector Set to Lead: A Bullish Opportunity in the Making
As we move forward, the transportation sector is primed to outperform the broader market, and the current setup presents an ideal buying opportunity for those with a keen eye. If the Dow Utilities close below the 801-804 range, the initial breakout attempt by the Dow Transports is likely to fail. This will likely prompt a widespread belief that the transportation sector is headed for a breakdown, but in reality, the opposite is poised to unfold. A temporary dip below 10,500 for three consecutive days in the Dow Transports will significantly increase the likelihood of a move to the 9300-9600 range. For aggressive traders, this creates a golden opportunity to load up on stocks in the transportation sector, such as WERN, PTSI, FWRD, and ULH, all of which stand to benefit from the inevitable rebound.
The key takeaway is that sectors currently unloved and underperforming—such as transportation—often present the best opportunities when the broader trend is still positive. In fact, when a sector is hated and the broader trend is still bullish, it’s often the perfect time to establish long positions. The ideal scenario for maximizing returns would see the Dow Utilities undergo a sharp pullback, allowing the Dow to follow suit and creating a fantastic opportunity for investors to step in at a lower price.
In the face of any substantial pullback next year, the prudent course of action is to resist panic and stick to the game plan. As long as the broader trend remains intact, any pullback should be seen as a mere speed bump, not a cause for alarm. Instead of reacting with fear, investors should take a more celebratory approach—grab a bottle of your favourite beverage and prepare for the opportunities that lie ahead. With the transportation sector set to rebound, the long-term outlook remains bright, and those who stay the course will be well-positioned for significant gains.
Unveiling Market Insights: Favorable Prospects for Dow Utilities and Buying Opportunities
Based on the trend, market sentiment and the state of Dow (trading in the extremely oversold ranges), the favoured outcome would be for the Dow utilities to experience a sharp pullback. Short-term traders can watch the 801 to 803 ranges; a breach of this zone will indicate much lower prices. If the utilities pull back firmly the Dow Industrials and Transports are likely to take the same path, and in doing so will create a lovely buying opportunity for 2020.
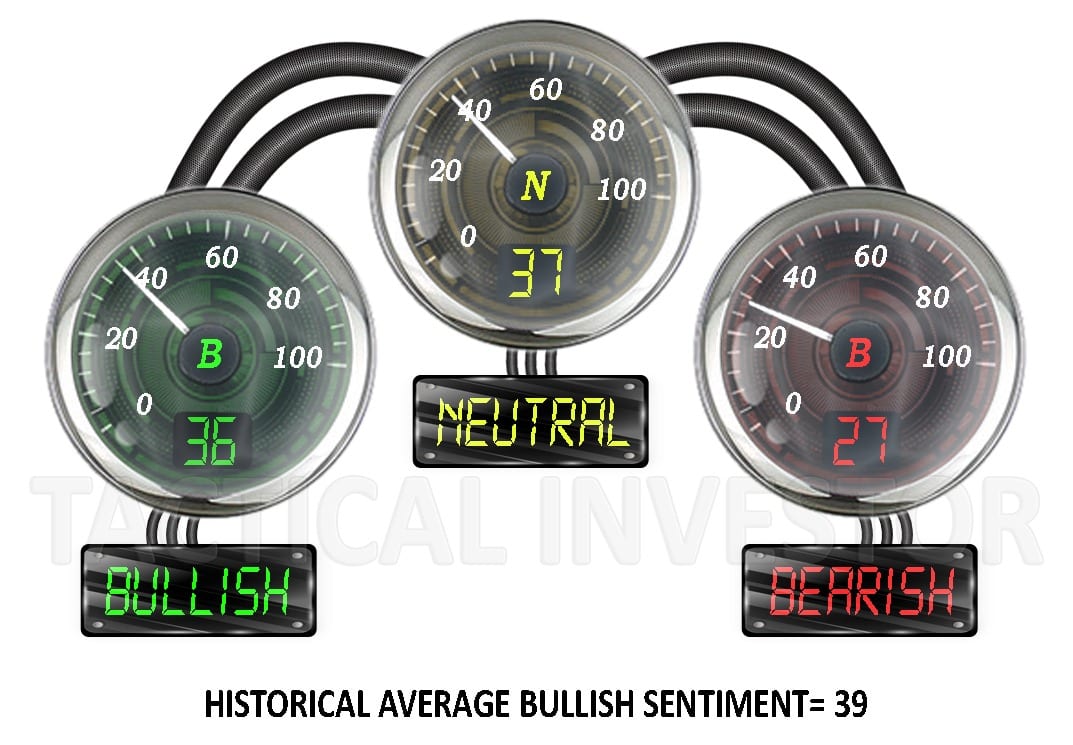
The Dow is trading close to 28K again, and if one looks at the sentiment, one would be inclined to think that it was trading closer to the 26.5k range. Neutral sentiment has inched up another two points, and it’s almost at a 3 month high. Bullish readings are well below their historical average of 39. Overall, market sentiment indicates that a strong pullback, if it comes to pass, has to be viewed as an opportunity. Market Update Dec 10, 2019
Unveiling the Market’s Reality: Challenging Expert Predictions and the Pitfalls of Bias
The Dow is now trading well above 28k, and bullish sentiment is still trading below its historical average. In short, we can conclude that next year’s market action will catch 90% of experts with their pants down. All the experts, even those who got the first part of this bull market right, are wearing their emotions on their sleeves. How do we know? All one has to do is pay attention to their political bias. If you have a bias (politics or finance), your vision is clouded, hence your analysis.
Navigating Market Trends: Embracing the Long-Term Approach and Avoiding Pitfalls
Some subscribers have asked us why we don’t short the markets; our focus is on the long-term trend. While it looks like it is easy to gauge the direction of the trend, we can assure you that it’s not. We don’t want to be in a position where we are stuck looking at two opposing trends in two different time frames and in doing so miss out on both ends. This reminds us of the story of the donkey that kept looking for a tastier haystack; in the end, the idiot died of starvation.
Hence, while the trend is up, we will focus on the long trades and vice versa. Finally, note the market update is a tool that can also be used to meet your own needs; thus, if you have time and are comfortable with shorting the market, you may do so. The best way to minimize the risk factor when shorting the market is to use put options; one knows upfront how much one could potentially lose. Market Update Feb 11, 2020

Dow Transports Market Insights: A March 2020 Update
No Panic, Just Opportunity: A Strategic Approach to the Current Sell-Off
In short, there is no reason to panic. If this sell-off continues at its current pace, it will inevitably set the stage for a monumental buying event. The key point here is that those who give in to panic will miss it, as panic clouds judgment and makes it difficult to distinguish between opportunity and disaster. Reflect back on 2008, when countless investors missed out on tremendous gains simply because they believed the market could only go lower, a mistake that left them on the sidelines as the market surged back.
Given the severity of the sell-off, a rally is almost inevitable, though the first attempt is often a failure. If history proves true, once this rally fizzles out, it will likely lead to another downward wave, potentially even taking the market to new intraday lows. This is where things get interesting: if the pattern aligns, we could explore a short-term put play or an open-up strangle position—an options strategy where you open both a call and put position with different strike prices. This allows you to capitalize on the volatility that comes with such market movements.
Most importantly, remember to keep a trading journal. The best time to take notes and learn is when “blood is flowing freely on the streets”—when the markets are in chaos and uncertainty reigns. This is when true investors thrive, learning from the panic and using it as a powerful tool for future success. So stay calm, stay strategic, and remember that opportunity often emerges in the most unexpected of places.