Trading volatility: Stick With The Trend
Updated Dec 2022
Volatility will keep rising as we are in the battle of the trenches phase. This means the situation will sometimes appear horrendous (as is the case now). This battle of the trenches (BOTT) will end. Once this phase is over, it will become a full-frontal assault (FFA); in stock market terms, the market will reverse course and soar. At the end of each BOTT phase, the Fed will throw even larger sums of money into the markets, triggering the next FFA phase.
The COVID crash of 2020 created the illusion that all corrections and crashes were easy to handle, and all you had to do was buy the dip, and you would be fine. Apps like Robin hood made it easy for individuals stuck at home to log in and buy stocks. We also had the meme trade boom; this all helped create an environment that made passive investors feel that just pressing buy was all there was to win in the stock market.
Buying the dip is only half of the formula. Not every correction ends quickly, and some corrections take longer to resolve, but the result is the same. Those with the resolve to hold on always walk away with significant gains.
Before we continue, the Russian-Ukrainian war is not responsible for this severe pullback. The black swan event of the West imposing self-defeating sanctions turbocharged the supply chains issue. These sanctions affect those imposing the sanctions more than the Sanctioned nation. These issues will miraculously end as soon as the big players purchase all the necessary shares.
Don’t Panic
While you might feel like panicking, there is a reason we labelled quantitative easing as forever QE.; it’s never going to end. To create the illusion that the dollar is strong, the Fed will intervene and raise interest rates from time to time, as they did in 2018, to make it look like they are dealing with inflation, but then they will suddenly back off and throw 2 to 3x more money at the market. The world is locked in a global currency race to the bottom; the idea is to finish last.
Some signs that a lot of the speculators are getting battered come from the following headlines:
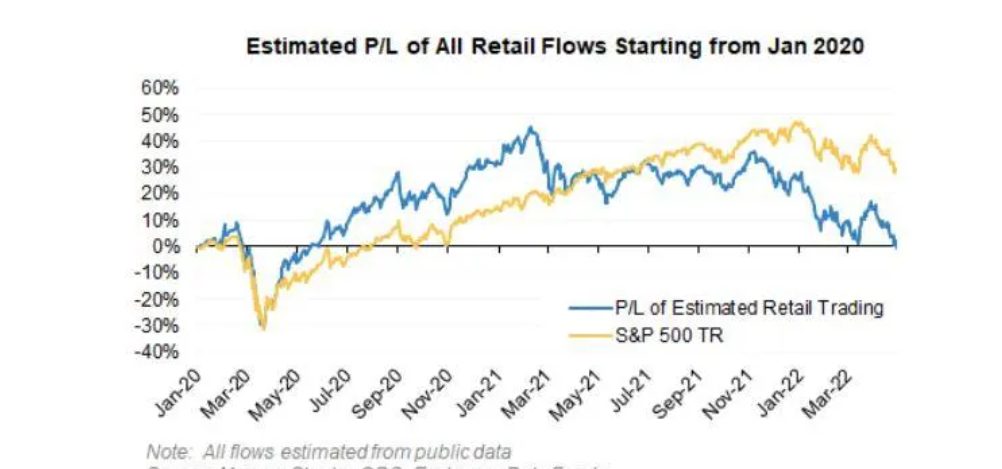
Day Trader Army Loses All the Money It Made in Meme-Stock Era

Nursing losses in 2022 that are worse than the rest of the market’s, amateur investors who jumped in when the lockdown began have now given back all of their once-prodigious gains, according to an estimate by Morgan Stanley. The calculation is based on trades placed by new entrants since the start of 2020 and uses exchange and public price-feed data to tally overall profits and losses.
Cathie Wood’s ARKK is the worst-performing US equity fund in Q1 2022: Morningstar
Foreigners pull money out of EM portfolios for the second month
Portfolios posted a net outflow of $4.0 billion last month, compared to outflows of $7.8 billion in March and inflows of $39.8 billion in April 2021. China saw a net outflow of $1 billion, debt posting outflows of $2.1 billion, and equities a $1.0 billion inflow. https://cutt.ly/7HtXun8
43% of investors say they’re too nervous about entering markets.
That’s sparked worry for some investors. Some 43% said they’re too nervous to invest in the market right now, according to Allianz Life’s Quarterly Market Perceptions study, an online survey of more than 1,000 adults conducted in March. That’s a nearly 10 percentage-point increase from the previous quarter, the survey found. In addition, more than half of respondents worry about a market crash, and 81% expect trading volatility to continue in the market this year. https://cutt.ly/AHtXTkl
There are many other stories, but we will stop here; they all point to one main factor: over 50% of those claiming to be passive investors were speculating the same way the meme stock traders were. The only difference is that they gave their money to other people (money managers) to speculate for them.
The second factor, probably just as important, is that the crowd is uncertain. Our analysis indicates that 55% of the masses are unsure. Historically such developments indicate the markets are usually 1-3 weeks from putting in a bottom. However, whether this is the final or intermediate bottom remains to be seen. Market action will provide clues.
The Great Resignation, meet the Great Reset.
This week, a spate of tech companies – largely those valued above $1 billion from their venture capital investors – announced reductions in their workforce. I wrote three layoff stories in fewer than 24 hours, a cadence I haven’t experienced since the beginning of the pandemic. These stories may have the same ledes, but they feel dramatically different.https://cutt.ly/aHtZAAml
The story is the first signal that the labour market will ease? This will be bad news for workers as real inflation won’t stop, but pressure on wages could start to drop a lot faster than many expect as there are going to be a lot of layoffs announced in the weeks, months and years to come. The real inflation we are referring to is the increase in the money supply, and it started the day we got off the Gold standard.
The theme behind this severe downturn (correction) is to scare the masses so much that no one will question the Fed when they throw 8 to 10 trillion dollars into this market. Before COVID, the government was crying about infrastructure plans that would cost a trillion dollars and various other projects running in the billions. The main goal of today’s government is to rob Peter to give scraps to Paul while sending the bulk of the money to their masters.
The COVID Hammer
When COVID struck, these fiscal hawks had no problems approving 5 trillion, and nobody made any noise. Why? They sold the story that the world would end, and everyone believed them, so there was no resistance. No one will make any noise when they throw 2X more and possibly 3X more to calm the chaos they created. The carnage looks terrible, but many stocks will be trading up to 10X higher from their lows in the coming years. A simple examination of past crashes will prove this to be a fact.
Under no circumstances should you fall for the Fed will raise rates “for a very long time story“; they simply cannot and will not do that. The worst crash in history, when viewed via a long-term chart, would look like one of the best buying opportunities ever.
If you think the markets won’t make a comeback, and this is it, you are in for one helluva shock in the years to come. Many investors will view the highs of 2021 as a bargain in the coming years, so imagine what they will feel like knowing they could have accumulated shares at a much lower price during this challenging phase. It happened at a much faster pace in 2020 and slower when the markets bottomed in 2009. Both cases’ results were mind-boggling returns for those that did not throw the towel in.
Conclusion
The coming Melt-up will be of epic proportions because the Fed has only one option “inflate or die”. The Fed will find a way to change the inflation narrative, even if it involves lying or manipulating the data. They will also raise their inflation target from 2% to 3.5 to 4.5%, creating a new norm. Eventually, the normal for inflation will be 11 to 15 per cent; that sounds insane. What’s even more insane is that almost no one will make a big noise. QE will never end, so no matter how severe the correction/crash, it must be viewed as an opportunity if you are an astute investor. There is a mega-boatload of money waiting to hit the market.
The last two holdouts in the market are Apple and MSFT; both are cracking, indicating that we are close to a final capitulation. This capitulation is going to entail a series of selling climaxes. Each drop allows the top players to deploy some of their funds. They have too much money to deploy it one lot. But they will signal that the last lot has been deployed; continue reading to find out what it is.
Hotmoney rules the markets
To give you an idea of how much money these chaps have, consider the following scenario:
Before we got off the Gold standard, they had 10 million to play with; it then went up to 100 million, then it went up to 10 billion, then 100 billion, then 1 trillion. Now it’s in the mega trillions. So logically, we must contend with more extreme moves in both directions. Some estimate that these shadow players have more than money the combined GDP of the world to play with.
Regardless of the sum, one thing is sure since we left the Gold standard, the sum has gone up by at least 10,000%, and that’s a conservative estimate. And it is going to keep rising. You have to understand how the fractional reserve banking system works. Banks only have to hold 10% of the money in reserves; the rest can be lent. You deposit 100 in a bank, and the bank can lend 90. That 90 is deposited into another bank, which now lends out 89. This process can continue until the 1K of new currency is created, backed by only 100 USD.
Don’t fight the Forever QE Trend.
Throw credit into the equation, and the situation gets downright explosive. You get a Line of credit for 100K (at bank A). It’s backed by almost nothing. You deposit this into bank B. Bank B can now lend 90K out and so on.
When the Fed throws 5 trillion into the markets, that sum can turn into 50 trillion under the fractional banking system. Now you have a rough idea of how much money is sloshing around—what a lovely scam for banks—the ability to charge interest on money that belongs to someone else. The big players own these banks. Now you understand why the top players create panic-like events. They have too much money to play with, so they have to drive even more individuals to give up their top shares for next to nothing.
The more money they have, the longer it takes to deploy these funds. Hence, the corrections are more brutal as they have to push many players to dump their shares. They are getting so good at this game that they are now breaching the 10% barrier, where the top traders reside. The ratio will change from 90:10 to 92 to 93 shadow players by the end of this correction.
What’s the End game?
Eventually, they will control between 96 to 99 per cent of the market. As the share of top traders drops from 10% to the 1 to 3 per cent ranges, trading volatility will rise. Why? They will force players who fall under the “strong hands” category to dump their shares. That’s what’s taking place now. You would never dump at the bottom right if you knew the end game. And the sad part is that everyone knows the end game; they are just scared to act on this knowledge.
Once the top players have deployed 90% of their capital, there will be a final selling wave, but in 9 out of 10 times, the markets reverse course and end the day several hundred points higher. For example, the Dow initially sheds 1000 points but finishes 700 higher. Why? Because the last 10% is deployed in the open market (no limit orders). They do this to provide astute investors with a silent signal that a change in direction is in the works. As the selling pressure eases, the path of least resistance is up.
No Crash In History Destroyed The Market
This time-tested formula has been used over and over again. No crash in history ended the market, and no stock market crash in the future will end the market. And as the money supply increases, these corrective stages will be more volatile, but the rally phase will be 2 to 4X more explosive. Those selling now are throwing in the towel, which will take them years to recoup psychologically. By the time they recoup, they will have missed all the action. That happened after the dot.com, the 2007 to 2009 crash, the covid crash, etc. One needs to get used to the fact that trading volatility will continue trending upward due to the printing press. Despite the nonsense, the Fed spews, its only mission is to defraud investors by increasing the money supply.
Crashes always end for one reason; the money and 2x more that left the markets always return. The only remnant from this crash will be all the smashed egos, portfolios, etc., for those who let fear rule the roost. The big players never lose. You know the folly of jumping out of the markets if you understand that. If you are not using the money you need for your daily living expenses (which you should never do), you can do what the rich guys are doing, sit it out and walk away with a nice bundle. The top players never try to buy at the bottom; they aim to get in at a reasonable price. Over the short term, they can take paper losses of up to 50%, for they know the long-term outcome in advance, as do you.
Research on using trading volatility to your advantage
- Diversify your portfolio: Research suggests that a well-diversified portfolio can reduce the risks of investing in volatile markets while providing long-term growth opportunities. A study by Vanguard found that investors with a diversified portfolio that included stocks, bonds, and alternative investments were better equipped to handle market volatility and saw better long-term results than those who only held stocks. https://www.vanguard.com/pdf/ISGDCA.pdf
- Use stop-loss orders: They limit an investor’s losses by automatically selling a stock if it drops to a specific price. This can be an effective strategy for managing risk in volatile markets, as it allows investors to protect their gains while limiting their losses. A study by the University of Illinois found that using stop-loss orders can help investors reduce their losses during market downturns. https://www.sciencedirect.com/science/article/abs/pii/S016920701630020X
- Look for opportunities in oversold stocks: Research suggests that buying oversold stocks can lead to profitable returns over the long term. A study by Morningstar found that stocks with a high “discount to fair value” tended to outperform the market over the long term. https://www.morningstar.com/articles/729163/cheap-stocks-are-cheap-for-a-reason
- Use dollar-cost averaging: This strategy involves regularly investing a fixed amount of money, regardless of market conditions. This can help investors take advantage of market volatility by buying more shares when prices are low and fewer when prices are high. Research suggests that dollar-cost averaging can lead to more consistent returns over the long term. A study by Fidelity found that investors who used dollar-cost averaging saw higher returns than those who tried to time the market. https://www.fidelity.com/learning-center/trading-investing/markets-sectors/dollar-cost-averaging


