Uranium Price Chart: Is Uranium a Smart Buy?
Updated April 30, 2024
Uranium, a crucial raw material for nuclear power, is experiencing significant changes in its market dynamics. Several factors are converging to reshape the uranium price and supply landscape, indicating a potential increase in its value.
Demand Outlook:
Nuclear power plays a vital role in the global clean-energy strategy. Demand is expected to rise substantially as global energy consumption is projected to double over the next two decades.
Small Modular Reactor (SMR) technology advancements have expanded nuclear power’s applications, further driving uranium demand.
According to the World Nuclear Association (WNA), demand for uranium in nuclear reactors is expected to climb by 28% by 2030 and nearly double by 2040 as governments ramp up nuclear power capacity to meet zero-carbon targets.
Supply Challenges:
Insufficient investment in new production capacity due to low uranium prices after the Fukushima incident has delayed the introduction of new primary supplies into the market.
Geopolitical events and disruptions caused by the COVID pandemic have added to the supply landscape’s uncertainty.
As of December 31, 2023, Cameco, a significant uranium producer, has commitments requiring delivery of about 27 million pounds annually from 2024 through 2028, with commitment levels higher than the average in 2024 and 2025.
Price Movements:
The uranium spot price displayed volatility in Q1 2024, rising to a high unseen since 2007 before ending the quarter below US$90 per pound.
Uranium pushed past US$100 per pound in January 2024, marking a significant milestone, although it has pulled back.
Experts believe fundamentals remain strong and expect the sector to benefit from various tailwinds. Prices could potentially outrun the recent US$107 highs from February 2024.
As the global energy landscape evolves and the demand for clean energy sources grows, the uranium market is poised for significant changes. The interplay of increasing demand, supply challenges, and price movements will shape the future of this essential commodity.
Uranium Shortfalls: A Rising Concern and its Impact on Global Prices
The uranium market is navigating through a significant shortfall, with global repercussions as prices surge. The shortfall has been exacerbated by recent news on January 12, 2024, that Kazakhstan, one of the world’s leading uranium producers, will experience a drop in production. This announcement sent uranium prices soaring even further, adding to the existing anxiety in the market.
This supply-demand imbalance could persist for years to come. Latest reports show that the global demand for uranium stands at approximately 192 million pounds per year, while the supply lags at around 156 million pounds. This shortfall of 36 million pounds is equivalent to the annual requirements of about 90 average-sized nuclear power plants.
Despite the unfolding scenario, the solution is not as simple as opening new mines. Uranium mining is a time-consuming process, and it could be several years before new mines can be produced at full capacity. Meanwhile, the demand for uranium continues to rise, with many new nuclear power plants under construction worldwide.
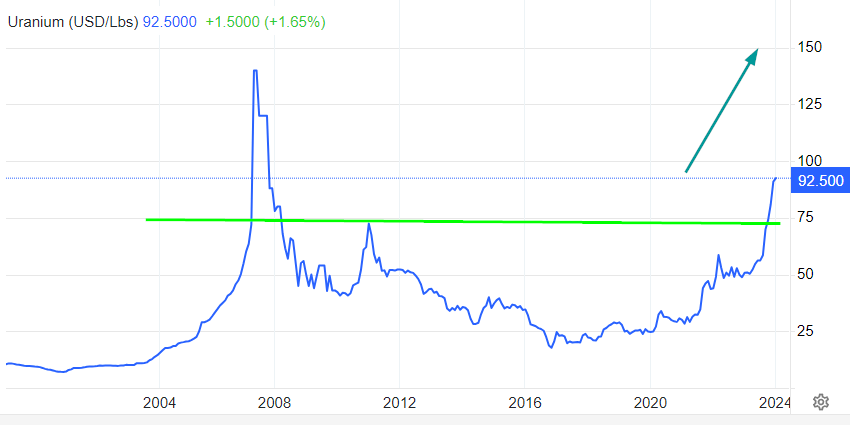
Uranium Price Chart: Supercharged & Ready For Takeoff

Source: www.tradingeconomics.com
As of Nov 19, 2023, Uranium is crafting a visually compelling and robust pattern, breaking through all previous resistance zones. The pivotal factor hinges on achieving a monthly close above 75, preferably 78, unlocking the path to 141 and beyond, marking a series of new all-time highs. Astute investors should welcome and embrace sharp pullbacks, recognizing them as strategic entry points to capitalize on market sentiment and potential opportunities. Tactical Investor Update Nov 19, 2023
Uranium is showing a solid and impressive trend. It has broken through previous resistance levels and is now setting the stage for new record highs. What’s important now? Uranium needed to close above 75 to 78 on a monthly basis, and the higher the close, the better the long-term outcome. It culminated the month at 81, surpassing hidden resistance pivot points and further strengthening the long-term bullish case. Uranium has now paved the way for a move to the 141 and a series of new record all-time highs. Market Update Dec 3, 2023 (sent out to subscribers)
However, it’s crucial to remember that the journey to these new highs will not be a smooth ascent. The market is often characterized by sharp pullbacks that occur seemingly at random. These pullbacks are usually favoured by prominent market players who understand that these abrupt, unpredictable downturns can create anxiety among investors.
But instead of succumbing to worry, these pullbacks should be viewed as excellent opportunities for new market entry. They offer a chance to enter at a better price point, and with the current shortfall and rising demand, it seems all but sure that the $150 mark will be surpassed. As stated, uranium will likely trade to a new set of all-time highs.
The uranium market is in flux, with supply shortfalls and rising demand creating a dynamic and unpredictable landscape. However, with careful observation and strategic decision-making, opportunities can be found amid the uncertainty.
Conclusion
Bridging this gap presents challenges, given the lengthy process of opening new mines or expanding existing ones. While additional sources are planned, their output may take years to meet rising demand sufficiently. Timely investments and solutions are needed to address this supply crunch to support the anticipated growth of nuclear power capacity and its role as a reliable, low-carbon electricity source.
As the industry stands at the cusp of a transformative era, ensuring a sustainable uranium supply will be vital in balancing the market and enabling nuclear energy to fulfil its potential. This likely requires optimizing production from current sources while developing innovative new supply streams.
From now on, we’ll explore history to emphasize the value of learning from the past. Plus, we’ll show how we not only ‘talk the talk’ and ‘walk the walk,’ demonstrating the importance of aligning words with actions.
Navigating Anomalies and Profits at Tactical Investor
At Tactical Investor, we keenly observe such anomalies where bullion prices continue to ascend while stocks in the sector undergo corrections. These occurrences are “Intra-market Positive Divergences,” which typically serve as exceptionally bullish long-term indicators. This suggests that the modification observed in Uranium stocks is likely just a result of routine profit-taking.
It’s a familiar scenario: the masses often follow the herd and make decisions contrary to their best interests. They tend to sell precisely when they should be considering buying. In our view, Uranium represents a compelling long-term investment, and we recommend everyone have some exposure to this sector.
However, it’s essential to remember that, as with any sector, not all stocks are primed for purchase simultaneously. Some have already experienced substantial price surges and are now poised for further consolidation. Caution is advised, and it’s worth remembering the adage, “The road to hell is paved with good intentions.”
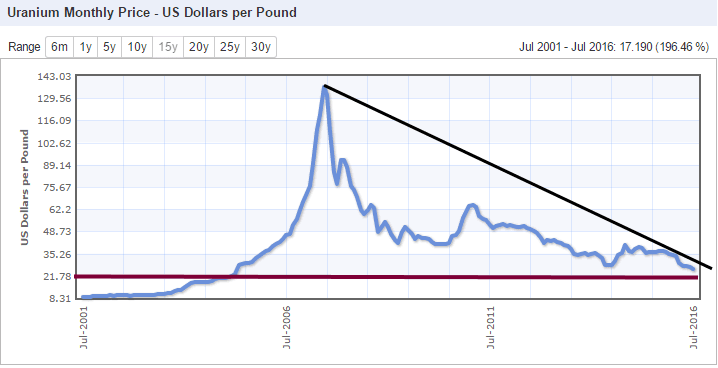
Tactical Investor Uranium Market Update – August 2018
By any reasonable estimation, the uranium market is currently trading within the realms of extreme oversold conditions. However, in a downtrend, markets can persist in these highly oversold conditions, a phenomenon we’ve witnessed on multiple occasions.
The 15-year chart reveals that the next layer of support is $21.50 to $22.00. Despite the current state of extreme oversold conditions, there is still potential for the market to trend lower. One positive development is that the trend is on the verge of transitioning into a neutral state. If this occurs, it would mark the first move into the neutral zone in quite some time.
Source:www.indexmundi.com/
Uranium Bull Market 2018: Examining Crowd Psychology
Considering a long-term perspective, a monthly close above the $35 mark would be a crucial indicator signalling the potential establishment of a multi-month bottom in the market. From a contrarian viewpoint, uranium appears enticing below $23.00.
When evaluating the uranium market in 2018, it’s essential to shift the focus away from the uranium price chart and redirect it towards understanding the collective behaviour of the masses. While price levels do hold significance, it’s equally crucial to gauge market sentiment. In essence, if the masses are exhibiting euphoria, it may not be the opportune moment to buy, and conversely, the inverse holds true.
Four things come not back. The spoken word, the sped arrow, the past life, and the neglected opportunity.
Arabian Proverb Sayings of Arabian Origin
Compelling Piece Worth Delving Into

Define Indoctrination: The Art of Subtle Brainwashing and Conditioning

The Statin Scam: Deadly Profits from a Pharmaceutical Deception

Copper Stocks: Buy, Flee, or Wait?

Dow 30 Stocks: Spot the Trend and Win Big

Coffee Lowers Diabetes Risk: Sip the Sizzling Brew

3D Printing Ideas: Revolutionize Your Imagination

Beetroot Benefits for Male Health: Unlocking Nature’s Vitality

Norse Pagan Religion, from Prayers to Viking-Style Warriors

Example of Out of the Box Thinking: How to Beat the Crowd

6 brilliant ways to build wealth after 40: Start Now

Describe Some of the Arguments That Supporters and Opponents of Wealth Tax Make

What is a Limit Order in Stocks: An In-Depth Exploration

Lone Wolf Mentality: The Ultimate Investor’s Edge

Wolf vs Sheep Mentality: Embrace the Hunt or Be the Prey

Best ETF Strategy: Avoid 4X Leveraged ETFs like the Plague
Bitcoin Bubble: Riding the Wave or Evaluating Investment Potential


