Stock Market Psychology Chart: Your Emotional Investing Compass
July 14, 2026
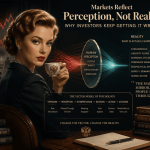
Where Emotion Writes the Tape
Markets are not driven by spreadsheets. They are driven by human behaviour. Price merely records the outcome after fear, greed, hope, and regret have already altered decision-making. Every rally, crash, and violent reversal begins as an emotional shift long before it becomes a technical one.
The Stock Market Psychology Chart captures that progression. It does not predict markets; it measures the emotional climate surrounding them. Panic compresses expectations until investors abandon reason. Euphoria expands them until risk disappears from view. The chart maps these transitions, allowing disciplined investors to recognise when perception has drifted furthest from reality.
History repeatedly confirms the pattern. In March 2009, bearish sentiment reached extreme levels while volatility exploded and market breadth collapsed. Those conditions marked the beginning of one of history’s strongest bull markets. By late 2021, optimism had reached the opposite extreme. Confidence remained elevated even as liquidity weakened and speculative participation peaked. The warning was psychological before it became technical. Months later, the Nasdaq entered a sharp decline.
Charles Mackay documented these cycles nearly two centuries ago. Confucius reached the same conclusion from another direction: those who cannot govern themselves will be governed by others. In financial markets, those “others” are the crowd. Panic becomes capitulation, disbelief evolves into optimism, optimism becomes euphoria, and euphoria inevitably returns to panic. Technology changes. Human wiring does not.
The Stock Market Psychology Chart is therefore less a forecasting tool than an emotional compass. It reveals where the crowd stands within the cycle, allowing investors to measure psychology before price fully reflects it.
Reading the Emotional Cycle
Every market advances through recurring psychological stages rather than random fluctuations:
Panic → Capitulation → Disbelief → Optimism → Thrill → Euphoria → Complacency → Anxiety → Denial → Panic
Each phase represents a dominant emotional state rather than a valuation model. Markets become dangerous when emotions reach extremes because expectations detach from underlying reality.
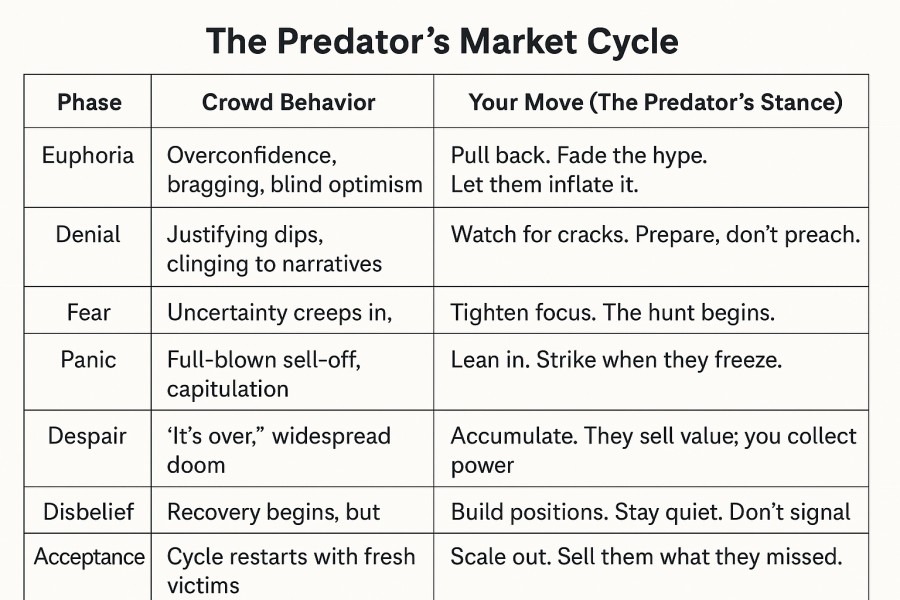
The chart highlights several recurring signals:
- Euphoria signals excessive confidence, where optimism has already been priced into the market.
- Despair marks emotional exhaustion, where forced selling creates opportunity.
- Hope often disguises denial as investors struggle to accept deteriorating conditions.
- Extended neutrality frequently reflects internal instability rather than balance, as conviction weakens beneath the surface.
Contrarians do not avoid these emotional extremes. They study them because the greatest opportunities emerge when consensus becomes most certain.
Sentiment Is a Leading Indicator of Behaviour
Most investors analyse economic data while overlooking the force that gives data its market impact: human interpretation. Markets rise and fall because millions of people react emotionally to information rather than objectively evaluating it. Stock Market Psychology Charts transform those emotional reactions into measurable signals by combining sentiment, positioning, and behavioural trends.
Properly interpreted, they allow investors to:
- Track changes in sentiment before they become visible in price.
- Identify emotional extremes where reversals become increasingly likely.
- Recognise divergences between optimism and weakening market structure.
- Avoid behavioural traps such as FOMO, overconfidence, and panic selling.
- Build positions when fear dominates rather than after confidence returns.
Extreme optimism rarely creates opportunity. Extreme pessimism frequently does.
Psychology Always Leads Price
Overconfidence rarely appears as excitement alone. It appears as low volatility, strong bullish sentiment, declining caution, and widespread belief that risk has permanently diminished. Ironically, these conditions often precede major corrections because expectations have already become unrealistic.
Fear creates the opposite environment. Volatility surges, bearish sentiment spikes, and investors begin treating temporary uncertainty as permanent decline. While the crowd liquidates positions to relieve emotional discomfort, disciplined investors prepare to accumulate assets whose long-term value has changed far less than their prices. The market therefore rewards those who recognise emotional extremes rather than participate in them.
Combining Psychology with Technical Analysis
No single indicator is sufficient. Psychology identifies where emotions are becoming unstable, while technical analysis reveals whether market behaviour confirms that instability.
Sentiment, price structure, momentum, liquidity, and macro conditions work together to reveal the probability of meaningful turning points. One signal may produce noise. Several independent signals pointing in the same direction create asymmetry.
This approach shifts investing away from prediction and toward probability. Instead of asking whether markets will reverse tomorrow, disciplined investors ask whether current expectations leave more room for disappointment or surprise. That question consistently produces better decisions than attempting to forecast headlines.
The Crowd Creates Opportunity
John Templeton famously observed that bull markets are born on pessimism, grow on scepticism, mature on optimism, and die on euphoria. The Stock Market Psychology Chart visualises precisely that progression.
The objective is not to predict every market turn. It is to recognise when psychology has become sufficiently one-sided that risk and opportunity are no longer balanced. The 2009 financial crisis, the March 2020 pandemic collapse, and the technology bubble all followed the same emotional blueprint. Sentiment reached extremes before price completed its reversal. Investors focusing solely on fundamentals often reacted too late because psychology had already begun changing direction. Markets rarely bottom when the news improves. They bottom when fear becomes exhausted.

The Market Is a Psychological System
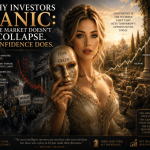
Markets move less on facts than on changing expectations. Price records the collective emotional state of millions of investors responding to uncertainty, opportunity, and risk.
Panic is not simply danger; it is forced liquidation. Euphoria is not genuine strength; it is confidence pushed beyond sustainability. Most investors buy emotional certainty and sell emotional discomfort. Disciplined investors reverse the process by buying when expectations have collapsed and reducing exposure when optimism has become excessive.
This is why mastering yourself matters more than mastering any indicator. Every market cycle ultimately becomes a contest between emotional reaction and disciplined reasoning.
Conclusion: Read the Crowd Before It Reads You
Markets behave like adaptive systems driven by changing expectations rather than static fundamentals. Headlines, economic releases, and earnings reports matter only because they alter collective psychology. Price follows behaviour, not the other way around.
The Stock Market Psychology Chart helps investors identify where emotion has overwhelmed judgement. Combined with technical analysis, liquidity, and sentiment data, it transforms market psychology from an abstract concept into a practical decision-making framework.
Charles Mackay showed how crowds repeatedly abandon reason. Richard Wyckoff demonstrated how informed investors exploit those emotional cycles through accumulation and distribution. Modern sentiment indicators simply measure the same behavioural forces with better tools.
The crowd still follows the same script every cycle. It buys certainty after opportunity has faded and sells uncertainty after opportunity has improved. Disciplined investors refuse to follow that script. They monitor emotional vectors instead of headlines, track expectations instead of narratives, and understand that the market’s greatest opportunities emerge where fear and greed have pushed perception furthest from reality.
The Stock Market Psychology Chart is not valuable because it predicts the future. It is valuable because it reminds you that markets have always been driven less by information than by the minds interpreting it. Understanding those minds is the closest thing investors possess to a lasting edge.