Editor: Vlad Rothstein | Tactical Investor
Dow Jones Stock Price: Trending Upwards Or?
Dow Jones Stock Price Future Action Can be Determined by looking at the Charts
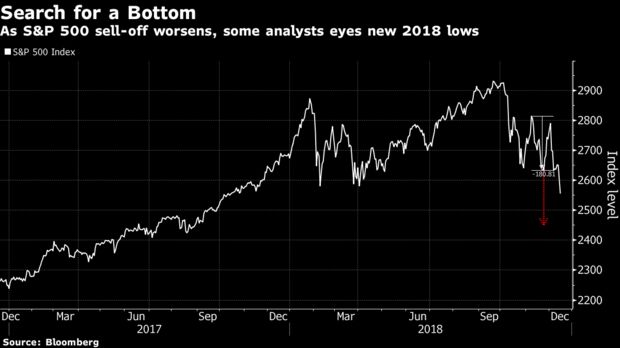
A chart level that most investors thought would never be tested again in 2018 is shaping up as its best hope after U.S. stocks staged their worst back-to-back declines since October. It’s 2,532.69 on the S&P 500, the intraday bottom touched on Feb. 9, and until Monday the lowest trading level of the year. It was briefly breached in the last 15 minutes before the index finished at 2,546, down 54 points to the lowest level since October 2017. The Dow Jones Industrial Average plunged 508 points, and the Russell 2000 ended 21 per cent below its August record.

To Russ Visch at BMO Capital Markets, it was just a matter of time before the February support caved in. One after another, past floors have given way as the sell-off deepened. Since the rout started in October, the index has fallen below its averages of the past 50 and 200 days. The latest breakdown came last week at 2,630, a level that had served as a cushion twice in the last two months. The April intraday low cratered Monday.
Visch says more pain is likely, citing a technical model called “measured move” that says, essentially, that downtrends get worse once a bounce fails.
“A move to 2,445 makes a lot of sense to us,” Visch wrote in a note to clients. “A close below the early 2018 lows will likely cause the ‘rush for the exits’ which brings the heavily negative, one-sided bearish climactic action that’s been missing so far.” Bloomberg
Conclusion
Experts talk big when things appear to be going their way; their biggest shortcoming is that they never learn from their past mistakes. One area stands out the most; there is not one expert that can prove that a stock market crash is not a great buying opportunity from a long term perspective. To date, every stock market crash has provided investors with a once in a lifetime opportunity of buying low and selling very high in the years that follow.
New Comments Oct 2019
Copper continues to put in a bullish pattern and once the MACD’s on the monthly charts experience a bullish crossover, we suspect it will not be too long after that before the markets explode.
According to the Tactical Investor alternative Dow Theory, if the Dow utilities trade to new highs, it is a good omen of things to come. In other words, the Dow industrials will follow the same path sooner or later. The Dow utilities surged to new highs in September and as a result, the Dow industrials and transports are expected to follow suit. The transport sector is expected to outperform the overall market.
Huge amounts of money have left the market indicating that the crowd is panicking at precisely the wrong time. History indicates that whenever the masses panic, that opportunity is usually around the corner. Hence the only one that is going to take another round of beatings is the masses.
The Markets are mimicking the pattern that of 2009; if this pattern completes it will lead to an explosive upward move.


