The Dow Theory: Is It Still Useful? Enhancing Its Effectiveness
Jan 09, 2025
It is the masses that move the markets, and if you can determine the emotion that’s driving them, you can determine the trend of the market. Sol Palha
The cyclical nature of history offers a valuable lens through which to examine financial markets. Using historical examples, we explore whether the Dow Theory remains relevant today, especially in a world shaped by unconventional monetary policies and evolving market dynamics.
Central banks have distorted markets through quantitative easing and prolonged low interest rates, creating a growing disconnect between financial markets and the real economy. Despite these changes, many investors adhere to the Dow Theory without questioning its applicability. It is time to consider an updated approach that acknowledges the changing market landscape while leveraging insights from the past.
Our stance remains clear: while the original Dow Theory provides foundational insights, it must evolve to maintain relevance. The overall market trend remains upward, and significant pullbacks should be viewed as opportunities rather than harbingers of collapse.
The Tactical Investor’s Alternative Dow Theory
Over 13 years ago, the Tactical Investor introduced an alternative version of the Dow Theory. This approach emphasises Dow Utilities (IDU), arguing that it leads market movements more reliably than industrials or transports. Observing the Utilities provides early signals of directional changes in the broader market.
For example, in early 2019, the MACD (Moving Average Convergence Divergence) for Utilities showed a bullish crossover, preceding similar movements in the Industrials and Transports. By May 2019, Utilities had reached new highs, and shortly thereafter, both Industrials and Transports followed suit, validating the predictive strength of the alternative Dow Theory. Historical consistency underscores its enduring value.
Historical Lessons: The Role of Utilities
The relationship between Dow Transports, Industrials, and Utilities has evolved. Utilities often signal market bottoms, but their patterns at market tops are less pronounced. Historical analysis reveals key instances where Utilities predicted broader market trends:
- 1966 to 1969: Utilities peaked in 1966, forming a triple-top pattern, while the Transports and Industrials followed with new highs in 1967 and 1969, respectively. The correction was broad-based, highlighting Utilities’ role as an early warning system.
- 1970s Recovery: Following a mid-1970s correction, the Transports led the recovery, setting new highs nearly a year before the Industrials. Utilities, however, moved sideways, signalling an impending deeper correction.
- 1980-1981: Transport reached three successive highs, while utilities remained stagnant, consolidating for a massive breakout. This period underscores the Utilities’ predictive importance for bullish and bearish cycles.
Modern Implications of the Dow Theory Alternative
Utilities have consistently outperformed in the past three years, serving as the harbinger of broader market trends. For example, between November 2005 and February 2006, Utilities broke out of a tight consolidation phase, followed by significant rallies in the Dow and Transports. Similarly, in October 2005, a sharp 13.66% correction in Utilities preceded a subsequent rally that brought new highs across all indices.
These patterns illustrate a recurring theme: Utilities lead market movements, and their corrections often serve as precursors to broader market consolidations or rallies. By monitoring Utilities, investors can gain valuable insights into potential turning points.
Dow Theory in the 21st Century
The traditional Dow Theory emphasizes the relationship between the Industrials and Transports. While valuable, this perspective overlooks the predictive power of Utilities, which have demonstrated a stronger correlation with market bottoms and directional changes.
For instance, in 2020, during the COVID-19-induced selloff, Utilities signalled a bottom before other indices, aligning with the Tactical Investor’s alternative theory. This underscores the importance of incorporating Utilities into modern market analysis.
Critiquing the Original Dow Theory
While the Dow Theory remains a cornerstone of technical analysis, its limitations are evident in today’s complex financial landscape. Its reliance on the Industrials and Transports overlooks other sectors that provide critical insights. Moreover, the theory was developed when manufacturing and transportation dominated the economy, making it less applicable to a service-oriented, technology-driven market.
The Tactical Investor’s approach addresses these shortcomings by integrating Utilities, representing essential services and infrastructure, offering a more holistic view of market dynamics.
The Psychology of Market Trends
Understanding market sentiment is crucial for navigating financial markets. The masses’ emotional reactions often drive trends, making contrarian strategies highly effective. For example, during extreme pessimism, as seen in the 2020 pandemic selloff, Utilities provided a steadying signal, indicating a market bottom.
Market corrections often evoke panic, leading many to abandon their investments. However, recognizing these moments as opportunities can yield significant rewards. By focusing on mass psychology and monitoring Utilities, investors can identify optimal entry points while filtering out the noise of sensationalist headlines.
Practical Applications and Insights
Investors can apply the alternative Dow Theory by prioritizing the following:
- Monitor Utilities: Pay close attention to the Utilities’ performance, particularly during overbought or oversold conditions. Sharp corrections in Utilities often precede broader market reversals.
- Analyze MACD Crossovers: Bullish or bearish MACD crossovers in Utilities provide early market trend signals.
- Embrace Corrections: Significant pullbacks should be considered buying opportunities, particularly when Utilities indicate a bottom.
- Diversify Focus: Incorporate insights from technology, healthcare, and industrial sectors alongside traditional indices to capture broader market trends.
The Tactical Investor’s Alternative in Action
In July 2023, the Utilities sector entered a consolidation phase, signaling potential market volatility. Utilities confirmed a bullish MACD crossover by September, aligning with a broader market rally. Investors who acted on this signal capitalized on subsequent gains, demonstrating the practical value of the alternative Dow Theory.
Similarly, the Tactical Investor’s approach identified opportunities in the healthcare and industrial sectors during the AI-driven tech rally of 2023. Investors achieved superior risk-adjusted returns by recognizing overbought conditions in tech and reallocating to undervalued industries.
Lessons for the Future
The markets are driven by cycles of euphoria and despair, often manipulated by unseen forces. Recognizing these patterns and understanding their psychology is essential for long-term success. The alternative Dow Theory provides a robust framework for navigating these cycles, offering clarity amid the chaos.
As the world grapples with geopolitical tensions, climate change, and technological disruption, the need for adaptive strategies has never been greater. By embracing the Tactical Investor’s alternative Dow Theory, investors can position themselves for success in an increasingly unpredictable world.
Tactical Investor Dow Theory: A Superior Predictor of Trend Changes
The Tactical Investor’s interpretation of Dow Theory offers a nuanced approach to understanding market dynamics, highlighting the unique roles of the Industrials, Transports, and Utilities in forecasting trend changes. This perspective reveals that while transport often leads to market advances and corrections, utilities serve as a critical indicator of market bottoms.
Insights from the 1970s: Transports Lead, Utilities Signal
Following a complex correction in the mid-1970s, the Industrials and Transports bottomed out and resumed their upward trajectories. Notably, the Transports hit new highs nearly a year before the Industrials, reinforcing their role as a leading indicator. However, the Utilities diverged, trading sideways from 1971 to 1973 before succumbing to a severe correction.
This divergence proved significant. While the Industrials reached new highs, the Utilities began to decline, ultimately dragging both indices to a 13-year low. Intriguingly, the Transports set a higher low during this period, signalling a potential bullish reversal.
Patterns and Predictions
The Transports frequently exhibit a bullish pattern, hitting new highs ahead of other indices, while the Utilities often reflect bearish tendencies. From 1980 to 1981, the transport sector marked three new highs, while the industrial sector and utilities traded sideways, accumulating energy for their next major moves. This extended consolidation period exemplifies a core Tactical Investor principle: the longer the channel formation, the more explosive the subsequent breakout.
Between 1976 and 1986, this dynamic played out vividly as both the Dow and Utilities staged dramatic upward moves, validating the predictive power of this refined Dow Theory framework.
Conclusion
The Dow Theory, while historically significant, requires modernization to remain relevant. The Tactical Investor’s alternative approach—centred on Utilities—offers a more comprehensive and actionable framework for understanding market trends. By combining historical insights with modern analysis, investors can achieve greater clarity and confidence in their decisions.
In investing, the trend is your friend. By recognizing the emotions driving the masses and leveraging insights from Utilities, investors can identify opportunities others overlook. The alternative Dow Theory is not just an evolution of a century-old concept but a roadmap for navigating the complexities of modern financial markets.
Historical records of the Tactical Investor Dow theory In action.
Revealing Insights: Dow Utilities vs. Dow Theory
July 2023 Update

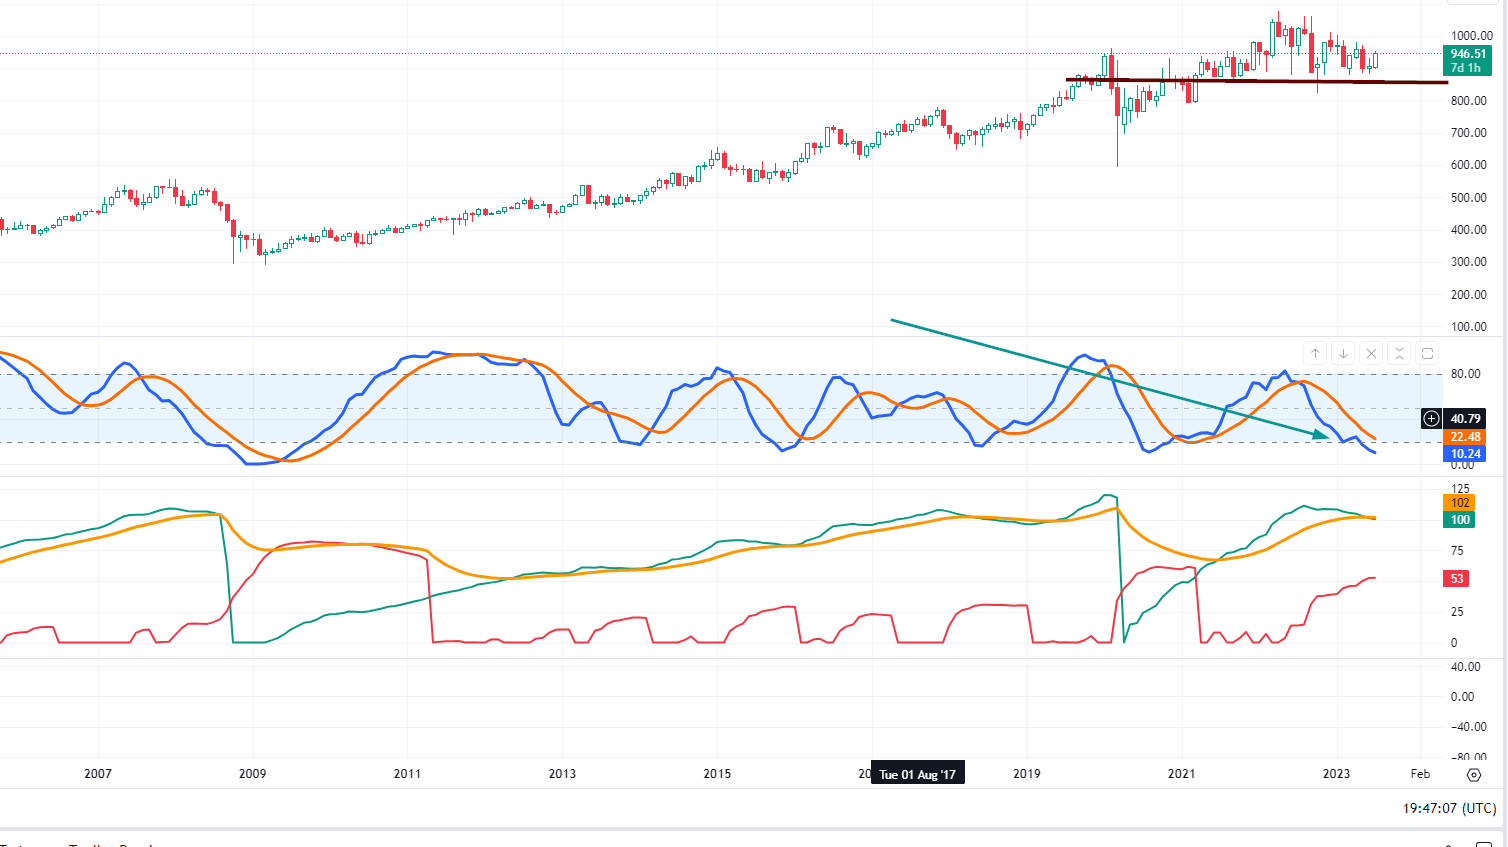
According to the Tactical Investor Alternative Dow Theory, the utility sector leads upward and downward. The industry is consolidating on the monthly chart, suggesting the market rally could lose momentum. Investors should watch for a clear buy signal from utilities, which may indicate a turning point. Corrections, whether mild or significant, should be seen as buying opportunities. Until such a signal appears, expect continued volatility.
A potential market bottom could be indicated by a bullish MACD crossover.
As of July 25th, 2023, intelligent investors should consider taking profits in the overvalued AI tech sector and use pullbacks to accumulate positions in healthcare and strong industrial stocks.
Mass Psychology and Market Trends
Understanding market sentiment is crucial. Mass psychology drives market trends, and identifying the emotions influencing the majority can reveal the market’s direction. As Sol Palha states, “It is the masses that move the markets; if you can determine the emotion driving them, you can determine the trend.”
Staying Aligned with the Trend
In investing, “the trend is your friend.” Following prevailing trends and identifying deviations allows investors to spot opportunities. With the current positive trend, any significant pullback could signal an attractive buying opportunity. Investors can navigate volatility and achieve long-term success by focusing on market sentiment and conditions.
Tactical Investor’s Version of Dow Theory
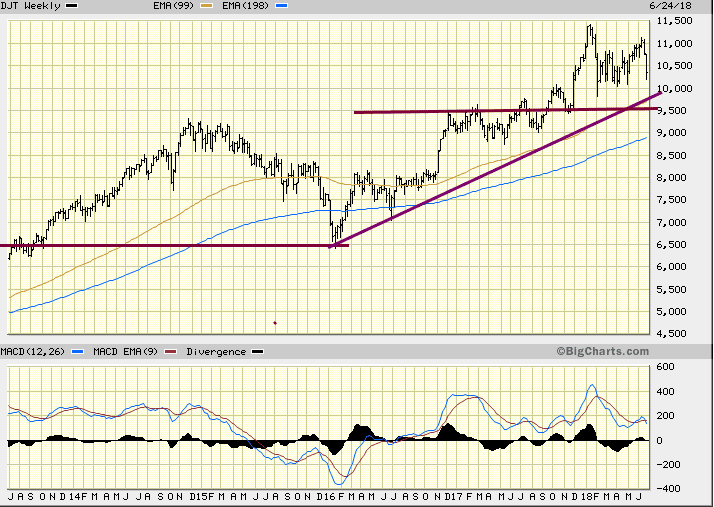
The Tactical Investor Alternative Dow theory, which seems to hold up almost 13 years since we first published it, states that the Dow utilities lead the way up and down. The Dow Industrials and Transports then follow suit, so it would pay to keep an eye on the utilities as it will give us an idea of what to expect from the Dow. On the weekly charts, the utilities are trading in the extremely overbought ranges and will soon move to the insanely overbought ranges, so a pullback shortly should not come as a surprise.
The MACDs in the Dow transports, just like those in the Dow industrials, have both not experienced a bullish crossover yet, proving that the Dow alternative theory still works. The MACDs in the Dow utilities have already experienced a bullish crossover, and IDU traded to a high of 149.41 in March 2019. Hence the odds favour that both the Industrials and transport will surge to new highs sooner or later. Market Update May 7, 2019
According to the Tactical Investor Alternative Dow theory, the Dow utilities lead the way up or down. The utilities are holding up just fine and are based on the ETF IDU; they just put in a new high; Translation, the Dow is likely to take the same path, and the same holds for the Dow transports. Market Update May 20, 2019
The Dow utilities traded to new highs, and according to the TI alternative Dow Theory, the Dow industrials should be next in line, and that’s precisely what took place. Once again, this theory we put forward years ago is still valid. Market Update June 23, 2019
To know yet to think that one does not know is best; Not to know yet to think that one knows will lead to difficulty. Lao-Tzu BC 600-?
References
More Questions Raised About Dow Theory, Barrons
Dow theory does not work anymore, HuffingtonPost
Sir John Templeton’s Template for success, Templeton.org
Dow theory does not work, how to invest in stocks, Tactical Investor
Extraordinary Popular Delusions and the Madness of Crowds, Charley Mackay
Intriguing Articles for Knowledge Seekers


