Stock Market Graph 2019: What Next?
There is no doubt that the stock market under Trump has performed extremely well and it will continue to perform well as long as the trend remains bullish.
When the trend is positive (UP) train yourself to view strong pullbacks, corrections and other negative developments through a bullish lens. Anyone can panic in the face of trouble, but only the astute individual can stand still and direct their energy to spotting opportunities. Don’t do what the masses are trained to do, for, after all these years of panic, they have nothing to show for it. Market Update Sept 15, 2019
The Dow did not drop below 25K, but it did trade down to the 25,700 ranges, and in doing so, it satisfied the minimum downside targets. This does not mean that the Dow cannot test the 25,000 ranges; as stated before we would be very happy if this came to pass. The crowd has continued to pull money out of the market, indicating as always their uncanny ability to sell at precisely the wrong time.
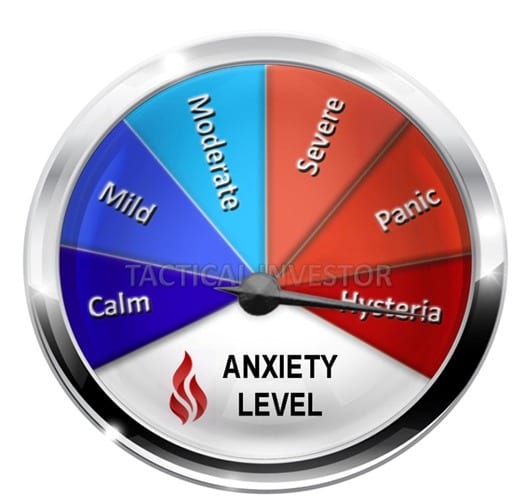
Masses are Anxious
The anxiety gauge is now deep in the hysteria zone, confirming that the crowd is going against the overall trend and that once again; they are on the wrong side of the markets. Note that we do not focus on short term periods; we focus on intermediate and long term timelines.
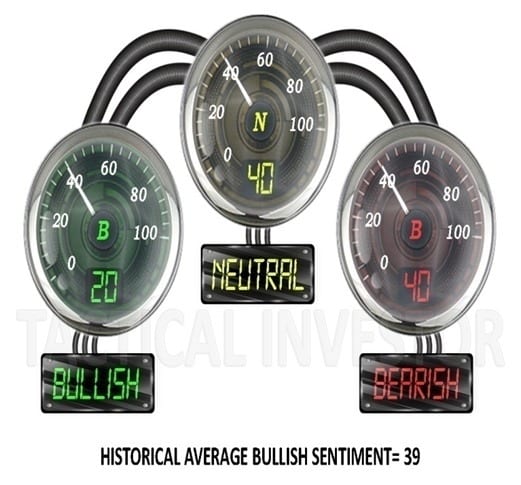
When you combine the bears and the neutral the score has consistently fallen in the 60-70 ranges, so what we need now is a shock type event, which will push this score up to the 75-80 ranges. Market Update Sept 25, 2019
The so-called strong pullback and we use the word “so-called” because when you factor in how high this market is trading from its 2009 lows or even 2015 lows, the current pullback is a non-event. Based on the weekly charts of the Dow, there is still room for more downside action before our indicators move into the oversold ranges.
However, the current pullback was sharp enough to create chaos in the sentiment camps. Bearish and neutral sentiment add up to 80%, and this has to be viewed as fantastic development. As we stated in the Sept 25th issue, we hypothesised that we could be moving towards a new norm.
The new norm is that it’s okay to be a bit nervous and sit on cash, so the only way to shake things up is to trigger stampede and that is what the top players might be gearing up to do. Investors are sitting on a huge amount of cash. Market Update Sept 25, 2019
The trend is positive and one should remember what we have stated all along; as long as the trend is bullish (positive) every pullback regardless of intensity has to be embraced and the stronger the deviation, the better the opportunity. The human mindset thrives on misery; it’s hardwired towards negativity
Stock Market Graph 2019: What’s Next For Trump Bull
Well, before, we continue one should make sure they know what they are doing when it comes to the stock market.
The single one thing any individual could do to improve their investment skills is; let’s start with what it’s not
- It’s not by learning Technical or pattern analysis and its It is not by learning how to read a company stocks reports
- It’s not by becoming an expert by studying the fundamentals of a company, or a host of other BS info. that the experts falsely promote
The solution boils down to one thing
Understand the mass mindset. The mass mindset is hardwired to panic, and once you understand this (i mean really understand this), you can reprogram your mind very easily. This is what mass psychology is all about understanding the mass mindset. However, remember that you are part of the mass mindset, so understand who you are and who you were so that you now can formulate a plan on the creation of the “New You”. Technical analysis is very useful but only once you master the basics of mass psychology
Stock Market Graph 2019: Is The Dow Going To Continue Trending Upwards?
Every time the MACD’s experienced a bearish crossover (dating back to Dec of 2017), the Dow has experienced pullbacks ranging from medium to strong. The current chart suggests that the corrective phase has just begun, but there is one big difference between the current pattern and the previous ones. On the monthly chart, the Dow was trading in the extreme to insanely overbought ranges, but now it’s trading very close to the insanely oversold zone, so downside action should be limited in terms of intensity and duration.
We have a stunning development
The combined score of netural and bearish sentiment has surged to 80, and that is extremely telling. We looked at our records quickly; this is the highest reading in over 24 months. The last time the combined score was so high, the markets mounted a stunning rally a few months later. Consider that we are trading several 100% points away from the 2009 lows and the masses are almost as scared as they were back in 2009.
The only difference was that the bearish sentiment was much higher, but the overall combined score of bulls and bears was dangerously close to the current one. In our books neutrals are bulls without B***S and bears without teeth; in that sense, the neutral sentiment is a better gauge of market uncertainty and fear because it represents the weakest elements from both the bullish and bearish camps.


Market Sentiment states Stock Market Under Trump unlikely to crash
While it’s hard to be calm when the markets are volatile, history illustrates (and we have done this in real time several times over the past few years), that the best time to buy is when the markets are volatile, and the masses appear to be hanging for dear life. Even though it feels like the markets should crash and burn, due to all the horrendous news out there, market sentiment is not supportive of a crash type scenario.
If the markets were to crash, it would be the first time in history a bull market ended on a note of uncertainty. History is never kind to the crowd and we don’t think that picture will change in the near future. Take a look at the sentiment gauges above; they clearly indicate that the stock market under Trump is not going to crash. In fact, any strong pullbacks should be viewed through a bullish lens, until the trend turns negative.
Trump and The Markets Update Jan 20, 2020
The media and large portion of the crowd are mistakenly assuming that the current state of affairs is due to Trump being president. Trump is part of the trend. He did not create this trend and if he had opposed the trend he would not have been elected. On the same token if he had tried to run for president in 2008 or 2012 he would have lost, as the current trend was not in motion at that time. The country is now firmly divided into two camps and polarisation levels while high, will continue to skyrocket. This is a perfect environment to manipulate the masses as the crowd is so worked up, they don’t see all the other nonsense that is taking place right in front of their eyes.
Other Stories of Interest
Trump Stock Market: Will Impeachment Hearings Derail This Bull (Nov 21)
Negative Thinking: How It Influences The Masses (Nov 15)
Leading Economic Indicators: Finally in Syn With The Stock Market? (Oct 28)
Dow Stock Market Outlook: Time To Dance or Collapse (Oct 25)
What Is Fiat Money: USD Is Prime Example Of Fiat (Oct 13)
Yield Curve Fears As Treasury Yield Curve Inverts (Oct 12)
Current Stock Market Trends: Embrace Strong Deviations (Oct 2)
Market Insights: October Stock Market Crash Update (Oct 1)
BTC Update: Will Bitcoin Continue Trending Higher (Sept 17)
Stock Market Forecast For Next 3 months: Up Or Down? (Sept 16)
Stock Market Crash Date: If Only The Experts Knew When (Aug 26)
Nickel Has Put In A long Term Bottom; What’s Next? (July 31)
AMD vs Intel: Who Will Dominate the Landscape going forward (June 28)
Fiat Currency: Instruments of Mass Destruction (June 18)
The Retirement Lie The Masses Have Been Conned Into Accepting (June 15)


