
Stock Market Crash Date: All Bark & No Bite
Updated May 01, 2024
We will begin by examining our past statements to establish a historical context, demonstrating why focusing solely on the stock market crash date is utterly impractical. As we delve into the lessons from history, we’ll gain valuable insights into the futility of fixating on a specific date for a market crash. Finally, we’ll conclude with our current views as of July 2023, offering a well-rounded perspective on the ever-evolving stock market landscape.
Experts are notorious for issuing dates and dire predictions, but on both counts, if one bothers to track their performance, one will find that monkeys with darts fare much better.
We stated this to our subscribers on the 11th of July 2019.
Looking at the chart below, it would be easy to conclude that we are about to push the “triple top” theory, but we are not. We are looking at the picture in terms of extreme resistance and extreme support zones. The Dow has tried to trade above the 26,800-27,000 range for almost 19 months. Furthermore, these attacks have been widely spaced out. Hence, the Dow is now at an inflexion point”; it either blasts above 27,000 and, in doing so, former resistance turns into solid support.
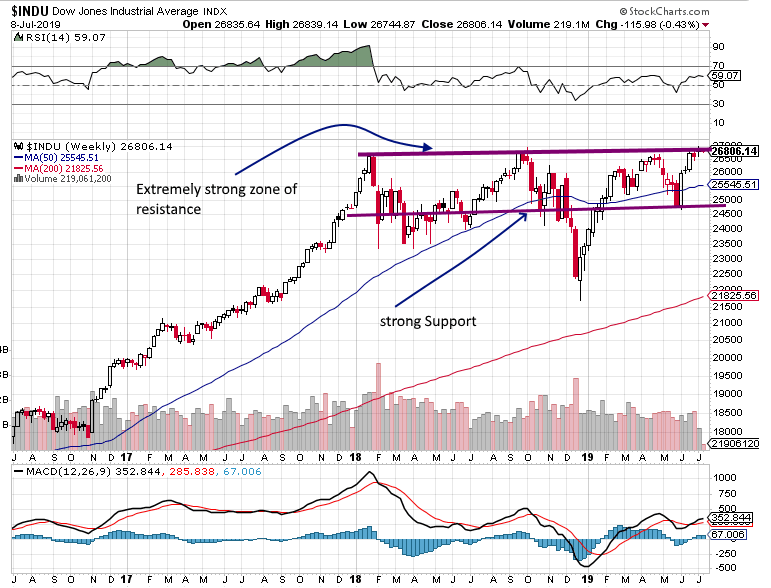
Forget the Stock Market Crash Date Argument; Focus on the Trend Instead
Alternatively, if it fails to maintain its position above 27,000 (after trading above it), a pullback may occur, ranging from moderate to significant. A mild pullback would likely conclude within the range of 25,500 to 25,800. On the other hand, a more substantial pullback, which will appear like a stock market crash to some, could bring the Dow down to around 24,500, with a variation of about 200 points in either direction.
This assessment is based on short to intermediate-term timelines, while the long-term outlook remains optimistic. We are not overly concerned about a sharp or moderate pullback since it primarily alters the opportunity factor. Significant deviations are seen as favourable opportunities when the overall trend is upward. In other words, the greater the deviation, the more promising the option becomes. If the scenario materializes, it will test your determination as an investor. It is easy to make purchases when the situation seems calm. Still, when it becomes challenging, many individuals tend to panic and retreat rather than embrace the potential opportunities that arise.
It’s amazing how when a market is soaring, everyone wants to get in and pay more and more, but the same individuals willing to pay more are now afraid to pay less for the same stock. End of Market Update, July 11, 2019
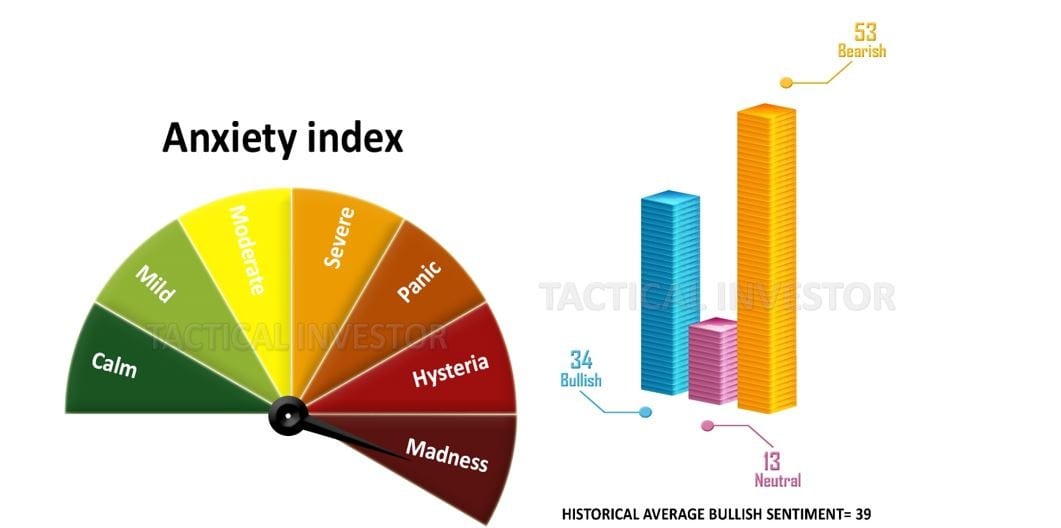
Market Sentiment is far from bullish.
Look at the gauges below, and it immediately becomes evident that the only ones that are scared are the ones that historically fare the worst. Anyone with a mass mindset falls under that category. In other words, lemmings will always be lemmings, and their only function in the markets is to be used as cannon fodder.
The long-term outlook for the Dow and the overall markets remains unchanged. On the monthly charts, the Dow is still trading in the oversold ranges, so this current pullback must be viewed through a bullish lens despite the gnashing of teeth. The only area of focus, therefore, should be directed at finding the best stocks to get into, as stocks are not created equal. For example, value investing is almost dead, as hot money is chasing momentum-based stocks. If you get into a momentum-based stock at the wrong time, despite solid fundamentals, you could be on the receiving end of the stick.
Stock Market Crash Date: Emphasizing the Trend, Not the Date
July 2023 Update
The current financial landscape resembles previous economic downturns such as the dot-com bubble, the housing market crash, and the 1973-1974 stock market crash. However, many ignore these similarities, believing the present circumstances are distinct. This mirrors the mindset before the housing market crash, where the peak was reached in 2007, followed by a recovery in 2008, and a devastating crash in 2009. This sequence of events left many investors wary and hesitant to re-engage with the market for several years.
The Aftermath of a Stock Market Crash: Current Investment Patterns
The current number of active investors is nearing, and expected to surpass, the figures observed in 2008, with over 61% of the population investing. Interestingly, most individuals aged 85 and above are almost fully invested. The bullish reading for this week has finally reached 50, marking the fifth consecutive week of bullish readings surpassing the historical average of 38.5 after 18 months below this average.
The Sriracha Scarcity: An Insight into Market Behavior
The ongoing shortage of sriracha hot chilli sauce provides a fascinating case study in market dynamics. The scarcity has driven the price up to over $70 per bottle on the secondary market. This year-long shortage has resulted in a surge in demand for the popular sauce, with resellers exploiting the situation by selling bottles at even higher prices. This scenario highlights the robust consumer demand for sriracha and the prolonged duration of the shortage.
The Peril of Misinterpreting Wants as Needs
The collective mindset often leads us to confuse desires with necessities. Once this happens, cost becomes a secondary consideration until financial resources are exhausted. This mentality is apparent in the stock market, where the belief that AI will revolutionize the world and that investing in the market is a surefire way to profit has led people to invest without considering the cost, confident that it will continue to rise. This is reminiscent of one of the earliest recorded bubbles, the tulip mania.
Market Outlook Update April 2020
Every bull market encounters at least one significant correction that is often mistaken as a market crash, and the recent downturn caused by the coronavirus pandemic serves as a harrowing moment for this particular bull market.
Maintaining a trading journal to document observations is crucial, especially during extreme market volatility when fear and uncertainty prevail.
Historical events like the crashes of 1987 and 2008 proved to be exceptional buying opportunities that occur once in a lifetime. Still, the current situation has the potential to surpass even those great setups and present the “father of all opportunities.” Such rare events may only happen once in an individual’s lifetime.
Just a few weeks ago, most investors would have eagerly desired the opportunity to purchase stocks at current prices, but within 28 days, they have surrendered and are fleeing the market. Volatility is likely to persist until the end of the month, particularly considering the substantial increase of 650 points in V readings, reaching an all-time high.
When the panic eventually subsides, it will give rise to an unprecedented feeding frenzy in the market. The combination of zero interest rates and the injection of two trillion dollars by the Federal Reserve, with no end in sight, will propel the markets to unimaginable heights within the next 18 months, surpassing today’s standards.
The Hazard of Succumbing to the “It’s Different This Time” Mentality
This mindset paves the way for a new perspective, making it easier to fall for the “it’s different this time” mentality. It also heightens feelings of euphoria, which will inevitably turn into intense fear and panic when the market experiences a downturn. While history may not repeat itself exactly, it often rhymes. The AI sector will probably experience a steep decline while cyclical stocks and key commodities witness higher lows during the subsequent market correction.
For those with a low to medium risk tolerance, it’s advisable to proactively reduce a significant portion of your long positions in stocks that are currently or have previously been part of the AI investment frenzy. As bullish levels continue to climb, the probability of reaching 55 becomes apparent, which inherently suggests a significant increase in bearish readings when the market sentiment shifts. When bearish readings start to climb, it’s time to take action.
Originally published on Aug 25. 2019 and subsequently updated in May 2024, this article offers enhanced insights and analysis.
Unlocking Ideas: Articles That Inspire Fresh Thinking

Millennials Retirement Reality: Less Than $100K in Savings

The little book of Common sense investing- focus on the Trend

Anti Aging Superfoods: Rejuvenate Your Way to Youthfulness

Mastering Record Keeping: Ensuring Investment Success

Russia’s Foreign Policy: A Resolute and Disciplined Approach

When To Buy The Dip: Your Path to Investment Success

The China USA war: The Trade War of the Century.

Cool Superpower Ideas: Exploring Excellence in Various Fields

Unleashing the Bear: Russia Strikes Syria with Impact

Igniting Passion: The Thrilling Digital Sex Revolution

Navigating Fear & Opportunity in the October Stock Market Crash

Freedom and Independence: Inalienable Imperatives

Lagging Economic Indicators: Time to Thrive or Perish

Unipolar World Shakeup: US Superpower Status Fading Away