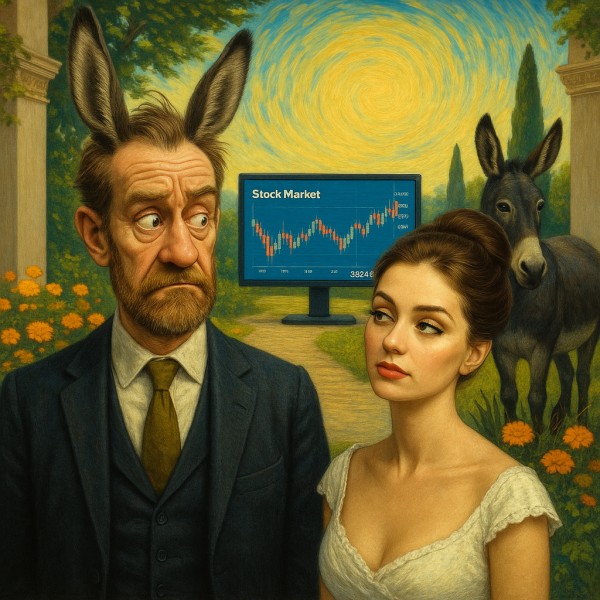
Sell in May and go away—return broke, post gains on display.
May 6, 2025
Introduction: Where the Curve Breaks
There’s no straight line to stupidity in markets—only curvature. Only warped surfaces of collective delusion, reversion loops misread as signals, and investor sentiment that doesn’t travel linearly but instead spirals, folds, ricochets. And nothing reveals this curved manifold more clearly than the calendar-based canard: Sell in May and go away.
This isn’t a strategy. It’s a mood. A ghost of past market tremors retrofitted into rhyme and passed off as foresight. But strip it down and what’s left? A reflex, a behavioural tick, a coping mechanism wrapped in a nursery rhyme. What we’re looking at isn’t timing the market—tracing a contour of fear.
Let’s not ask if Sell in May “works.” That’s linear. Instead, let’s ask: Why does it persist? What belief-geometry keeps this loop closed but never resolved?
The Month as a Mirror: Recurring Edges in Time
Seasonality is a comfortable fiction. The market, we’re told, has rhythms. May is when things sour. October is when things die. December redeems. But these aren’t patterns—they’re pressure points on a cognitive map.
Investors don’t respond to time. They react to narratives pinned to time. And those narratives mutate into biases: recency bias, anchoring, and selective memory. The May aversion isn’t about data—it’s about trauma. Crash cycles. Summer lulls. Headline droughts.
Technically? Sure. You can backtest May-to-October performance and compare it to November-April. But what you’ll find is an oscillating smear, not a signal. No clean edge. No repeating shape. Just a probabilistic echo chamber where past fears distort future risk-taking.
Markets don’t move because of a month. They move because participants anticipate others will believe the month matters.
Where Belief Folds In: Mapping the Narrative Spiral
In topological terms, we’re inside a belief manifold. Investors don’t move from A to B—they loop. They echo. They form basins of attraction around stories that feel predictive.
Sell in May isn’t a trade. It’s a ritual. The herd tells itself this tale every year not because it’s profitable—but because it’s familiar. And familiarity is the anaesthetic of uncertainty.
Here’s the trap: the more we repeat it, the more it seems real. It becomes a self-reinforcing attractor. A distortion field where the story of decline manufactures actual outflows. Not because fundamentals warrant it, but because everyone thinks everyone else is about to blink.
This is the narrative spiral. Not mass delusion, but shared orientation. Think of it like a topological vortex, where every trader’s model starts to bend toward the same local minimum. The selloff doesn’t come from truth—it comes from synchronised hallucination.
Bayesian Interrogation: What If the Frame Is Wrong?
Now let’s flip the whole thing. What if the “calendar effect” is just our way of dodging the real work—adapting to volatility without needing a reason?
Bayesian reasoning says we should update our beliefs when new data arrives. But what if we’re anchoring to the wrong prior altogether?
The prior here is that markets follow seasonal patterns. But this assumes a stationary system—one where risk premiums and macro signals unfold evenly over time, which is fiction.
In truth, the market is a non-ergodic, path-dependent entity shaped by bursts, gaps, and chaos clusters. Any strategy based on calendar logic assumes a closed frame where the environment is stable enough for May to matter.
But the environment isn’t stable. It’s a punctured surface. The entire frame is flawed. So instead of updating within it, we discard it and map behaviour directly.
This leads us to the question: What triggers collective disengagement during this part of the year?
Vector Shifts: How Sentiment Reorients
Now, enter vector logic.
Price isn’t just a point on a chart—it’s the visible tip of a hidden psychological vector. Each move is directional emotion: greed, hope, doubt, fear, capitulation. The vector’s angle matters more than its magnitude.
In May, the vector often tilts sideways. Not steep enough for panic. Not upward enough for euphoria. A kind of liminal drift. Traders rotate out. Portfolios rebalance. Volumes thin. That sideways vector feels like risk without reward—the emotional death zone.
This is what the Sell in May mantra captures, unintentionally. It’s an attempt to escape the vector flatline before it eats your edge alive. Not because the data says so, but because boredom kills more portfolios than volatility ever could.
And boredom breeds sloppy trades.
Fear Loops and Attention Voids: Structural Psychology in Motion
Zoom out. Think of the market as a layered topology of emotional energy. There are hype peaks, troughs of despair—but more importantly, voids—gaps in attention where no dominant narrative exists.
May through September often sits in that vacuum. There is no earnings adrenaline, no holiday liquidity, just drift and macro malaise.
And humans hate vacuums.
This triggers what we’ll call the fear loop. Deprived of clarity, investors default to caution. But caution seen in others becomes a signal, so even the whisper of exiting becomes self-fulfilling.
This loop isn’t based on danger—it’s based on the absence of noise. It’s silence as a signal, a predator-prey dynamic where inaction becomes a threat.
When Technicals and Psychology Collide
Let’s bring charts into this.
Technicals during May often enter ambiguity zones. RSI and MACD hover near neutrality. Breadth wanes. No clean reversal, no momentum. A flattened landscape.
That flatness doesn’t calm traders—it unnerves them. Humans aren’t wired for stillness. We mistake it for setup. Something must be coming. That expectation alone drives exit decisions.
This is ironic because this very expectation erodes price action further, triggering breakdowns that wouldn’t occur in a vacuum.
So, the technical confirms the psychological. But the psychological has already mutated based on misread technicals. There is a feedback loop. Belief distorts data, which then justifies more belief.
Sell in May isn’t a tactic. It’s a recursive hallucination.
Inversion: Holding While Others Wait to Sell
Now let’s invert.
What if May is the most honest month? What if it reflects the true mental state of investors—exhaustion, indecision, risk aversion—without the sugar-highs of catalysts?
That would make this stretch the most transparent part of the market cycle. Not exciting, but revealing.
This opens a contrarian opportunity, not to time reversals, but to use the lull to read sentiment without distortion, to front-run the late summer re-engagement phase before narratives get loud again.
In vector terms, the silence is directional. If you can stay present while others disengage, you can orient before the crowd snaps awake.
This isn’t about buying in May. It’s about listening when others turn down the volume.
Why It Stays: The Persistence of Market Myths
Sell in May survives because it’s easy. It reduces complexity to cadence. And cadence gives comfort.
But let’s call it what it is—a belief anchor. A mnemonic bias wrapped in rhyme, designed to soothe the sting of drawdowns and give structure to the amorphous.
The real damage comes when this belief prevents adaptation, when traders abort good positions not because the trade changed, but because the calendar flipped.
This is why topology matters. Time-based rules make sense if you think of markets as a flat plane. But in a warped terrain—a belief-space full of folds, tunnels, and false symmetry—the rules change shape as you move.
Sell in May isn’t a waypoint. It’s a mirage. One that persists because we keep walking toward it.
Conclusion: Curves Don’t Lie, But They Seduce, Then Shatter
There is no clean edge to risk—only seductive outlines, pulsating with the illusion of order. Belief doesn’t travel in straight lines; it spirals, curves, folds in on itself like flesh, flame, and memory.
Sell in May and go away isn’t a strategy. It’s a moan in the dark—a psychological release valve masked as wisdom. Traders chant it like a spell, not to time exits, but to soothe the ache of uncertainty. It’s not a map—it’s a scar. A soft scar carved into collective memory, hinting not at where to go, but where the pain once climaxed.
But if you want to transcend, don’t just watch the patterns. Don’t flatten the world into dates and slogans. Touch the surface. Feel the tension. Trace the emotional topography like fingers over skin, eyes locked on the tremble before a symphony’s drop, like teeth sinking into the edge of spice before sweetness explodes.
This is how you win—not by obeying, not by rebelling, but by sensing—how belief curls before it collapses, how price trembles before it screams.
Because in this market,
the curve doesn’t guide you.
It seduces you.
Then it dares you—
to hold on as it breaks,
to ride the tear in the chart like a scream across silk,
to taste volatility not as danger, but as nectar from the gods of mispriced fear.
It dares you—
to feel where tension coils under narrative,
to step where crowd certainty fractures into void,
to trade not the signal,
but the space between signals—
where belief collapses,
where patterns orgasm into noise,
where the smartest money isn’t logical,
it’s sensual.
You don’t follow the curve.
You become the pressure that bends it.
.


