
Unlocking the Truth: Does Technical Analysis Truly Work
Updated May 09, 2024
Technical analysis, a cornerstone of market trading strategies, is often debated for its effectiveness in predicting future market movements. This method, which involves the study of past market data primarily through charts, seeks to identify patterns and trends that can forecast future price behaviour. However, the efficacy of technical analysis is not absolute and requires more than just a superficial application of its tools. To truly leverage technical analysis, traders must go beyond the default settings used by the masses, as these standard parameters often lead to crowded trades that negate any potential advantage. Customizing these tools can provide unique insights that are not visible to everyone, offering a competitive edge.
Moreover, technical analysis alone is not a silver bullet. It must be complemented with an understanding of market sentiment, mainly through the lens of mass psychology. This combination becomes particularly potent during market extremes, such as panic or euphoria, where emotional trading distorts prices from their fundamental values.
Subtopic: The Synergy of Technical Analysis and Mass Psychology
Technical analysis has proven its worth in numerous instances where market conditions are volatile and unpredictable. For example, during market downturns, indicators like the Moving Average Convergence Divergence (MACD) can signal when a market is oversold, suggesting a potential reversal point. This was evident in scenarios like the early 2020 market crash, where technical indicators provided clear buy signals before the market rebounded strongly.
However, the true power of technical analysis is unleashed when combined with **mass psychology**. Mass psychology involves understanding the general mood of the market participants, which can significantly sway the market. By analyzing how the masses are reacting, whether in panic or greed, traders can better time their entry and exit points. For instance, during the 2008 financial crisis, the markets were technically oversold and gripped by extreme fear, which was palpable through various sentiment indicators and the pervasive negative news flow. Traders who recognized these signs of panic and combined them with technical buy signals were able to capitalize on some of the best buying opportunities.
In essence, the optimal time to buy based on technical analysis is often when the markets are technically oversold, and this is further reinforced when mass psychology indicates extreme fear or panic. This dual approach helps filter out noise and improve the precision of market entry and exit, maximizing potential returns while minimizing risks. Numerous traders have successfully employed this strategy, especially in recovering markets post-crisis or during sudden market corrections, where the combination of technical oversold conditions and extreme fear created ripe conditions for substantial rebounds.
Does Technical Analysis Work? New thoughts
The analysis of financial markets using technical analysis involves examining historical price data to forecast future price movements. This methodology operates under the assumption that past price movements offer valuable insights into the market’s trajectory. Technical analysis employs various tools such as charts, statistical indicators, and other techniques to identify patterns and trends in the market.
Harnessing Mass Psychology in Conjunction with Technical Analysis
Mass psychology plays a pivotal role in financial markets as it influences the behaviour of market participants. Since the market comprises individuals subject to emotions, biases, and beliefs, these factors often drive market movements. Understanding the sentiments and actions of market participants can provide valuable indications regarding the market’s direction. By incorporating mass psychology into technical analysis, one can identify market trends and patterns that aid in predicting future price movements.
For instance, investors tend to be optimistic and confident during a bullish market, while a bearish market prompts fear and pessimism. Technical analysis can leverage these emotions to pinpoint market turning points and anticipate future price movements. Combining mass psychology and technical analysis enhances the accuracy of future price predictions.
The Synergy of Contrarian Investing and Technical Analysis
Contrarian investing is an approach that involves taking positions contrary to prevailing market sentiment. Investors often buy when others are selling and sell when others are buying. This strategy assumes that the market frequently overreacts to news and events, causing prices to deviate from their intrinsic values. Contrarian investors aim to capitalize on these market overreactions and profit by adopting positions against the prevailing sentiment.
Integrating contrarian investing with technical analysis offers valuable insights into market turning points. While technical analysis identifies trends and patterns in the market, contrarian investing provides an alternate perspective on market sentiment. For example, if the technical research indicates a bullish trend, contrarian investing can help identify when the trend is likely to reverse. By exploiting market overreactions, investors can profit from contrarian positions.
Combining Mass Psychology, Contrarian Investing, and Technical Analysis
The combination of mass psychology, contrarian investing, and technical analysis further enhances the accuracy of predicting future price movements in financial markets. By incorporating these approaches, investors can make profitable investments in the market.
Technical analysis is a powerful tool for traders and investors seeking a competitive advantage in the stock market. By acquiring knowledge and employing specialised analysis techniques, one can make informed trading decisions and potentially increase overall profitability.
Remember, successful implementation of technical analysis necessitates a blend of knowledge, experience, and discipline. Continual self-education, staying abreast of market trends, and adapting strategies as necessary are crucial. Integrating risk management techniques into trading plans is essential to safeguard capital and minimize potential losses.
Expanding Your Understanding of Technical Analysis
To deepen your understanding of technical analysis, consider utilizing online resources, attending educational webinars or seminars, and studying reputable books authored by experienced traders. Immersing oneself in the world of technical analysis equips individuals with the tools necessary to navigate the complexities of the stock market.
In conclusion, technical analysis is valuable for traders and investors seeking a competitive edge in the stock market. By analyzing historical price and volume data, identifying patterns and trends, and applying technical indicators, individuals can make more informed trading decisions and potentially achieve greater success in their financial endeavours. However, it is essential to note that mastering technical analysis requires time, practice, and a commitment to continual learning.
The Power of Technical Analysis in Today’s Financial Markets
Market forces are changing rapidly, and we closely monitor the psychology behind the markets. Hence, we might issue a general sell signal. Before we continue, remember Tactical Investors never panic. Such a sell signal cannot be construed as a signal to panic. It simply implies that not all stocks might trade to the suggested exit points on time, and the better option would be to seek the best possible price on most of our holdings—an example of a general sell signal.
Close the following positions when the Dow trades in the 34 to 35k range. At that point, individuals would enter GTC orders slowly (remember, slow but sure as we never panic). The idea would be to aim for the best possible exit price. On the same token, we might also issue a general buy. For example, deploy 1/3rd into the following companies when the Dow trades in the 29 to 30k ranges. We could also mix match by issuing specific exit points on particular stocks while lumping a group of others into the general sell category.
Our strategy will be based on what the markets are doing. Once again, remember, we never panic. A Tactical Investor is the last to leave the room and the first to enter. We stroll in and out, leaving the running to the fools.
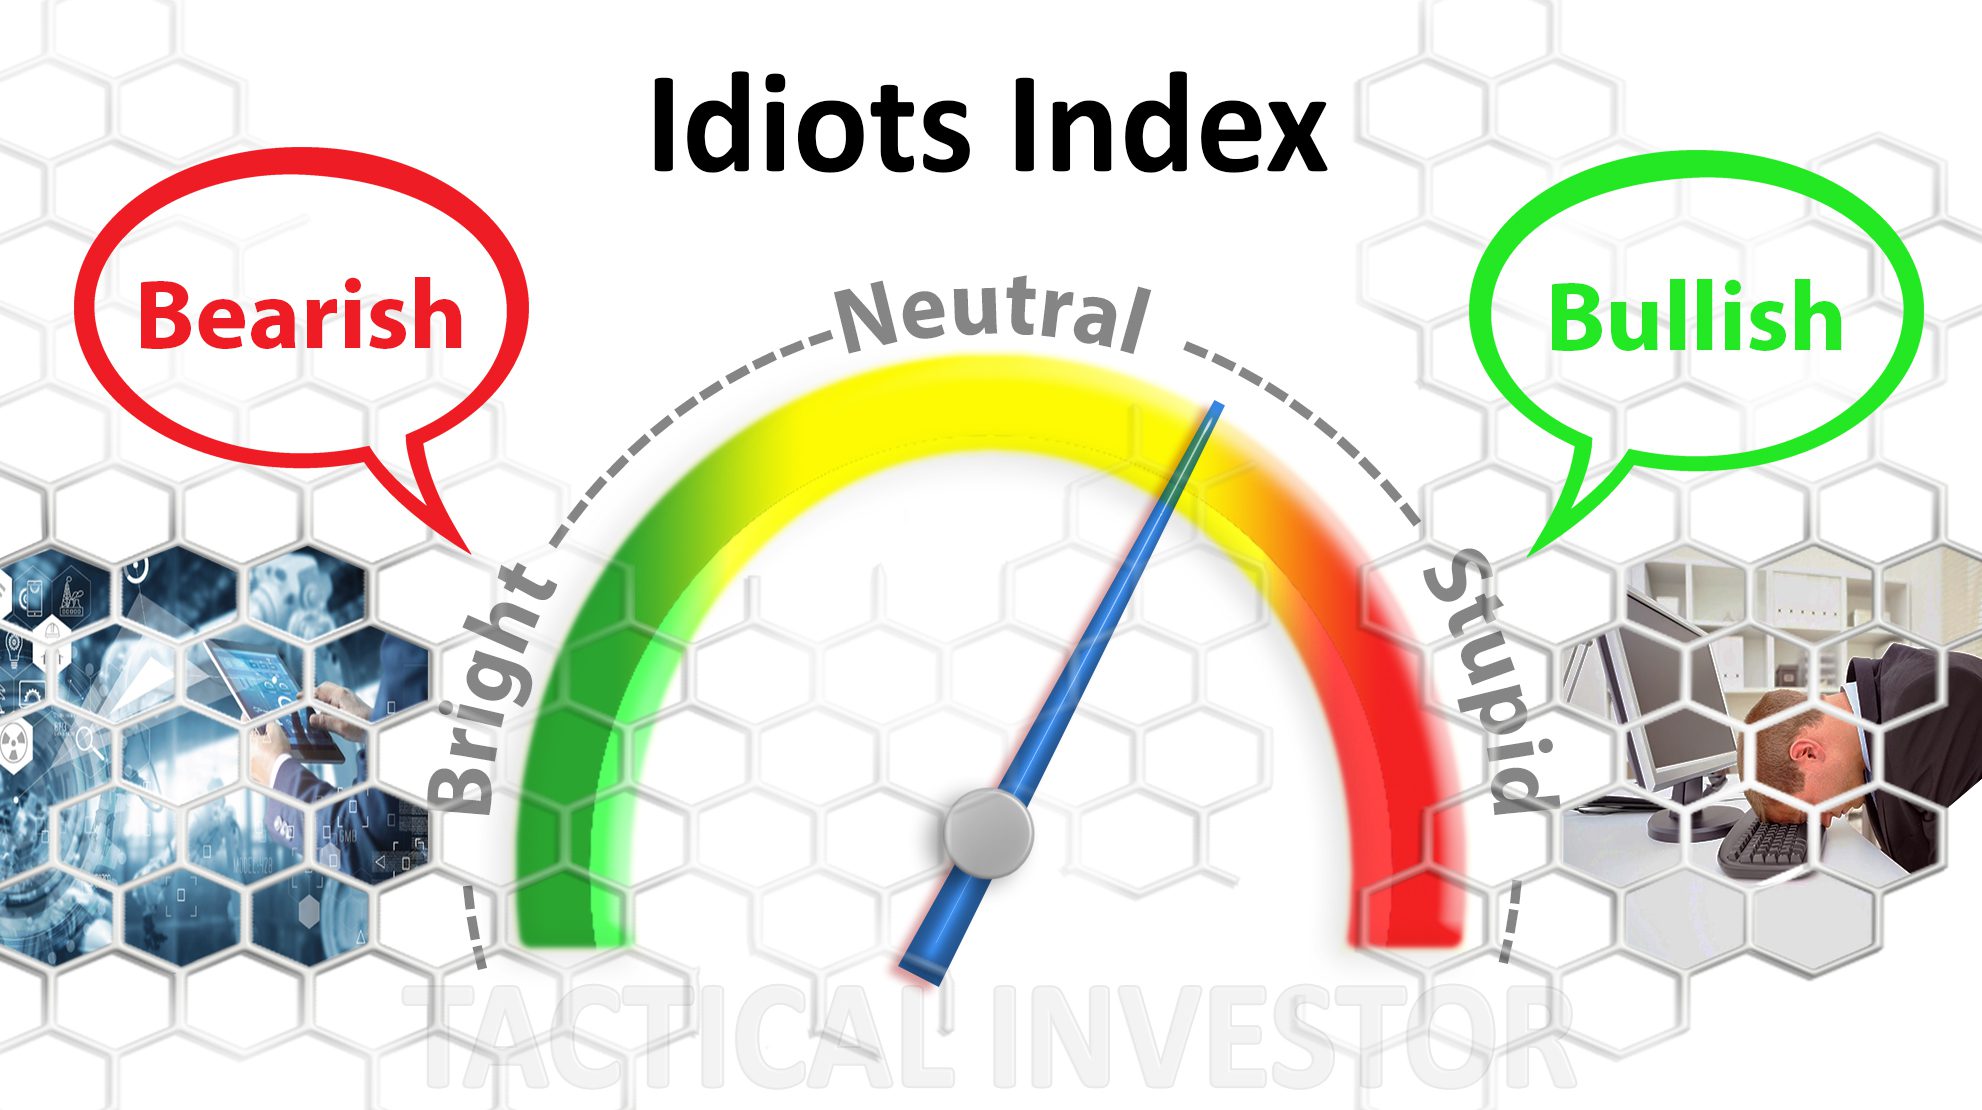
The idiot’s index is moving to the Neutral zone, indicating that intelligent individuals (but dumb investors) are becoming more confident. This suggests market action will be volatile as competent individuals generally make for the worst investors.
Articles That Challenge Conventional Wisdom

Inflation News: Real Inflation Set to Surge

Resource Wars: Navigating a Shifting Global Landscape

Crisis Investing: Turning Market Crashes into Opportunities

Yuan Vs Yen: Yuan On course to Challenge Yen

ASAN Stock Price Trends: Poised for Takeoff or Set to Decline

Ultimate Oscillator: The Volatility Indicator

Navigating Success: Top Stocks of 2016

Is The Stock Market Crashing: Separating Signal from Noise

Greenspan Put: Why the Maestro has it Wrong?

Financial Insights: Cutting Through the Noise

Strategic Precision: Navigating with RSI MACD Mastery

Herd Mentality Psychology: Predicted crude oil bottom

New American Economy: Unreal Recovery, Debt Financing

Federal Reserve Bank Definition: Unveiling Deception and Fraud

What In God’s Name is Fluorescent Sand

Freedom from Religion: An Observer’s Perspective

Unveiling the Dynamics: What is Inflation in Business
Research suggesting technical analysis works
The effectiveness of technical analysis is a subject of debate in the finance industry, and some studies support and refute its efficacy. However, here are some examples of research that suggest technical analysis can be practical:
- A study by Brock, Lakonishok, and LeBaron in 1992 found that technical trading rules could generate profits in foreign exchange markets over a short-term period. Source: Brock, W., Lakonishok, J., & LeBaron, B. (1992). Simple technical trading rules and the stochastic properties of stock returns. Journal of Finance, 47(5), 1731-1764.
- A 2019 study by Neaime and Gaysset found that technical analysis can be useful in predicting stock returns in Middle Eastern markets. Source: Neaime, S., & Gaysset, I. (2019). Technical analysis and stock return predictability: Evidence from Middle Eastern stock markets. The Quarterly Review of Economics and Finance, 71, 50-65.
- A study by Sullivan in 1999 found that technical analysis can be an effective tool for stock selection and market timing. Source: Sullivan, R. (1999). The effectiveness of technical analysis: A review. The Financial Review, 34(2), 43-63.
- A 2017 study by Kocenda and Kozubek found that technical analysis can effectively predict stock returns in emerging markets. Source: Kocenda, E., & Kozubek, P. (2017). Expecting stock returns: A regime-switching combination approach and economic links. Journal of Forecasting, 36(4), 441-460.
- A study by Lo, Mamaysky, and Wang in 2000 found that technical analysis could be used to enhance portfolio returns. Source: Lo, A. W., Mamaysky, H., & Wang, J. (2000). Foundations of technical analysis: Computational algorithms, statistical inference, and practical implementation. Journal of Finance, 55(4), 1705-1765.
