The New American Economy: An Unreal Recovery and the Role of Debt Financing
Updated Aug 28, 2023
Introduction
In the wake of the 2008-2009 financial crisis, the validity of the ongoing economic recovery warrants examination. On the one hand, one might posit the recovery’s legitimacy by observing the significant surge of the Dow since the crisis and by considering the arguable statistics from the BLS. However, a more astute analysis unveils a contrasting narrative. Upon deeper investigation, it becomes evident that the supposed economic recovery is but an illusion. Various factors underscore this scepticism surrounding the recovery’s genuineness.
Moreover, the landscape of the New American economy following the 2008 financial crisis has been marked by a recovery that seems more illusory than substantial. This recovery, predominantly propelled by debt financing and the practice of quantitative easing, prompts inquiries regarding the resilience and robustness of the U.S. economy. The Federal Reserve’s actions since 2009, involving the injection of substantial funds into the economy, have crafted an economic milieu that is simultaneously captivating and disturbing.
Quantitative Easing and the Illusion of Recovery
In response to the 2008 financial crisis, the Federal Reserve embarked on a policy of quantitative easing (QE), a process that involved the purchase of long-term securities to decrease interest rates and increase money supply. This policy, initiated in 2009, was aimed at stimulating economic activity during a period of severe recession. However, the effects of QE have been controversial, with critics arguing that it has created an illusion of economic recovery.
The QE policy has led to an increase in the money supply, which has, in turn, inflated asset prices. This has created a wealth effect, where individuals feel wealthier due to the increased value of their assets, leading to increased spending and investment. However, this wealth effect is illusionary mainly, as it is based on inflated asset prices rather than real economic growth.
The Role of Debt Financing
The New American economy’s reliance on debt financing is a double-edged sword. On one hand, it has provided a much-needed stimulus to the economy, helping to spur growth and recovery in the aftermath of the 2008 financial crisis. On the other hand, it has led to an exponential increase in the national debt, which stood at over $28 trillion in 2021. This debt, while useful in the short term, poses a significant burden for future generations who will be tasked with its repayment.
Moreover, the economy’s dependence on borrowed money has raised concerns about its sustainability. High levels of debt can lead to financial instability, as it leaves the economy vulnerable to shocks and reduces the government’s fiscal space to respond to future crises. The New American economy, therefore, finds itself in a precarious position, balancing the immediate benefits of debt financing against the potential long-term risks.
The Baltic Dry Index and Economic Strength
The Baltic Dry Index (BDI), a key indicator of global economic activity, paints a sobering picture of the New American economy. Since the 2008 financial crisis, the BDI has struggled to trade past its 2008 levels, suggesting a lack of real economic recovery. This inability to surpass its previous peak indicates that the global economy, and by extension the U.S. economy, may not be as robust as it appears on the surface.
The BDI’s performance provides further evidence of the illusionary nature of the economic recovery. It suggests that the recovery is not based on real economic activity, but rather on inflated asset prices and an increased money supply, both consequences of the Federal Reserve’s quantitative easing policy. This raises questions about the strength and sustainability of the New American economy, as it indicates a disconnect between the financial markets and the real economy. Therefore, the challenge lies in bridging this gap and fostering a recovery grounded in real economic growth and not just monetary expansion.
Interest Rates and Economic Foundation
The New American economy is currently navigating a delicate balancing act with interest rates. The Federal Reserve has recently begun to raise interest rates in an attempt to normalize monetary policy after years of near-zero rates. This move is intended to prevent the economy from overheating and to keep inflation in check. However, there are concerns that the U.S. economy, with its high levels of debt and weak economic foundation, may not be able to withstand higher interest rates.
The U.S. economy’s reliance on debt financing and quantitative easing has created a fragile economic foundation. This foundation, built on borrowed money and an inflated money supply, is vulnerable to shifts in monetary policy. If interest rates rise too quickly, it could increase the cost of servicing the national debt and put pressure on those who have borrowed heavily in the low-interest-rate environment. This could lead to a slowdown in economic activity and potentially trigger a recession, highlighting the precarious nature of the New American economy.
The New American Economy: Stagnant Real Wages and the Illusion of Prosperity
In the New American economy, one of the most striking and concerning trends is the stagnation of real wages. Despite nominal wage growth, when adjusted for inflation, the purchasing power of the average American worker has barely budged since the 1970s. This reality paints a stark picture of an economy where the fruits of growth are not equitably distributed.
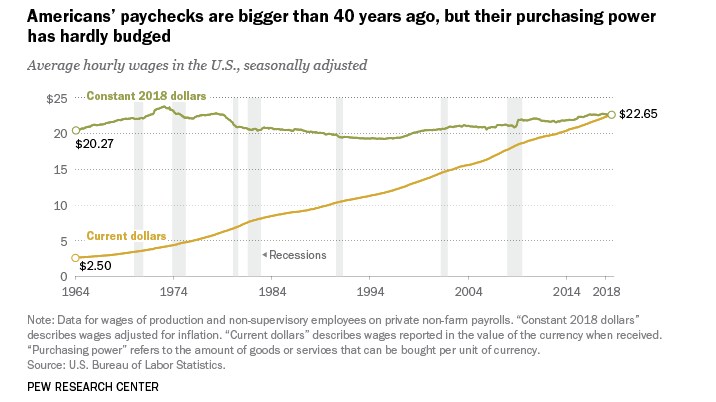
Source: https://www.pewresearch.org/
The Bureau of Labor Statistics reports that, in real terms, the average wage peaked more than 40 years ago. The disconnect between the growth in productivity and the stagnation of paychecks is a defining characteristic of the New American economy. While productivity has increased by 77% since the 1970s, the hourly pay of the typical worker has grown by only 12% over the same period, according to the Economic Policy Institute. This divergence suggests that workers are not receiving their fair share of the wealth they help create.
The stagnation of real wages in the New American economy has significant implications for income inequality. Many American workers cannot keep up as the cost of living continues to rise, particularly in healthcare, education, and housing. This has led to an increasing number of people living paycheck to paycheck, struggling to meet their basic needs despite employment.
Moreover, wage stagnation has also contributed to the growing wealth gap in the New American economy. While wages for the majority have remained stagnant, the earnings of the top 1% have tripled. This growing disparity in income and wealth threatens the social fabric and undermines the principles of fairness and opportunity that are fundamental to the American ethos.
In the New American economy, addressing wage stagnation is crucial. Policies aimed at increasing the minimum wage, strengthening labour rights, and promoting fair trade could help ensure that the benefits of economic growth are more equitably shared. Without such measures, the New American economy risks becoming an economy of illusion, where nominal wage growth masks a reality of stagnant real wages and growing inequality.
Income Inequality and Economic Mobility
Another critical aspect of the New American economy that raises questions about the reality of its recovery is the growing income inequality and declining economic mobility. According to data from the U.S. Census Bureau, the Gini Index, a measure of income inequality, has steadily increased over the past five decades. 2019, it reached 0.485, the highest level since the bureau started tracking it in 1967.
At the same time, economic mobility, the ability of an individual or family to improve their economic status, has been declining. A study by the Stanford Center on Poverty and Inequality found that 90% of children born in 1940 earned more than their parents, compared to only 50% of those born in the 1980s. This decline in economic mobility suggests that the American Dream, the idea that anyone can achieve prosperity through hard work, is becoming increasingly elusive in the New American economy.
These trends of growing income inequality and declining economic mobility indicate that economic recovery’s benefits are not evenly distributed. They suggest that while the economy may be growing on the surface, many Americans are not feeling the benefits of this growth. This further underscores the illusionary nature of the recovery in the New American economy.
Conclusion
The contemporary American economic landscape is a tapestry woven with threads of complexity and challenge, primarily shaped by the tenets of quantitative easing and debt financing. Beneath the façade of apparent prosperity, however, lie intricate layers that warrant meticulous consideration. The very nature of the economic recovery, its seemingly illusory aspects, the foundational reliance on debt financing, and the vulnerabilities of the financial bedrock all coalesce to raise poignant questions about the endurance and vigour of the United States economy. As we march forward into uncharted economic terrain, the imperative lies in confronting these multifaceted issues with determination, aiming to forge a future that is not only secure but also sustainable.
Beyond the surface allure of the New American economy lies a narrative that delves deeper into the enigmatic interplay of wage stagnation and the ever-widening chasm of income inequality. Though projecting an image of robustness, this economy grapples with underpinning disparities that necessitate introspection and action. As we navigate this intricate economic landscape, an indispensable task emerges the earnest and unswerving commitment to addressing these underlying challenges head-on. This endeavour isn’t solely about securing prosperity; it’s about fostering an equitable and promising tomorrow that encompasses the aspirations of all Americans.
References:
Quantitative Easing Explained. Federal Reserve Bank of St. Louis.
The National Debt Is Still a Problem. The Heritage Foundation.
Baltic Dry Index. Investopedia.
Interest Rates: Why They’re Going Up. The Balance.
Wage Stagnation in Nine Charts. Economic Policy Institute.
Income and Wealth Inequality in America: 1949-2016. Federal Reserve Bank of St. Louis.
Articles That Push the Boundaries of Knowledge