
Top Stocks of 2016: Uncovering Profitable Opportunities Through History
Updated Jan 27, 2026
We’re exploring this topic from a historical perspective for two compelling reasons. First, it vividly illustrates the old adage that those who neglect to learn from history are destined to repeat it. Second—and perhaps more importantly—it showcases our real-time actions. We don’t just talk about market strategy; we actively demonstrate it. Our primary instrument is mass psychology, which we employ to identify pivotal turning points. We then refine our approach with technical analysis, using TA to pinpoint optimal entry points while relying on mass psychology to determine the overall trend direction.
FXI: China Moving Toward the Bullish Zone
Back in 2016, the trend was slowly inching toward bullish territory while remaining technically neutral. Early signs of strength were already emerging in select stocks—TCEHY had been on fire and never looked back. Names like BABA, BIDU, and QIHU were putting in attractive bullish formations that caught our attention.
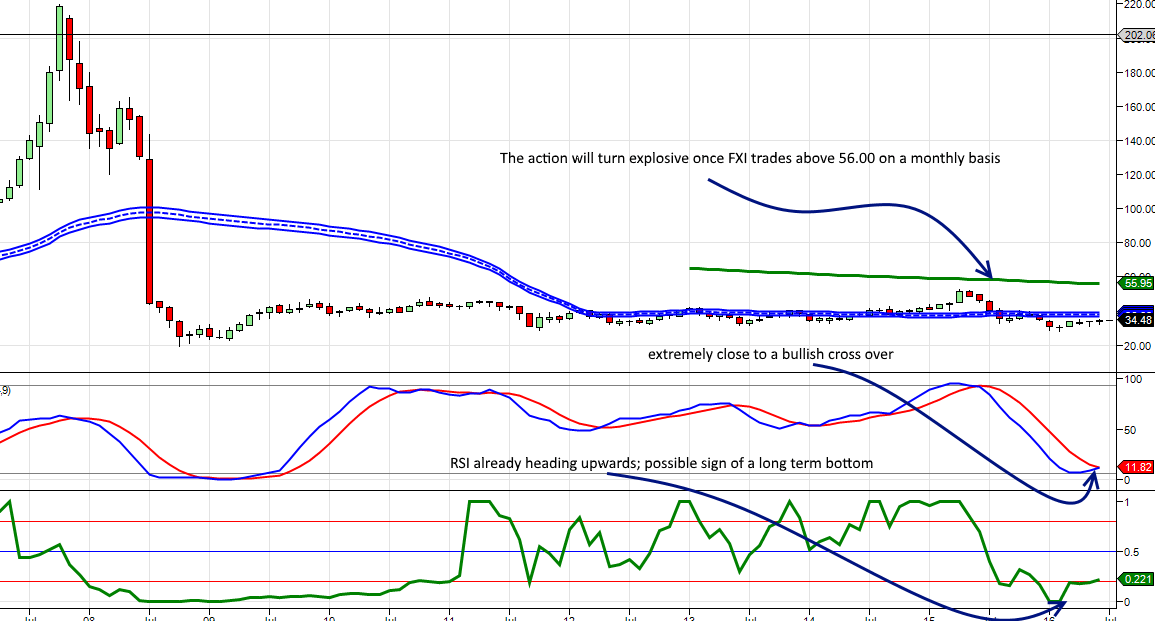
Even without a confirmed bullish MACD crossover at that time, many Chinese stocks were already breaking out—NTES and TCEHY among them. The MACDs appeared poised for a bullish crossover any day. Our overall long-term outlook remained decidedly bullish on China.
DIA: The Dow Ready to Roar
The weekly charts were trading in overbought territory, suggesting that a nice consolidation or decent correction would create a splendid buying opportunity. There was no need for a sharp correction, though we would have gladly embraced one. Our weekly indicators needed to move into oversold ranges, and the trend showed no signs of changing. May 17th, 2016 Update
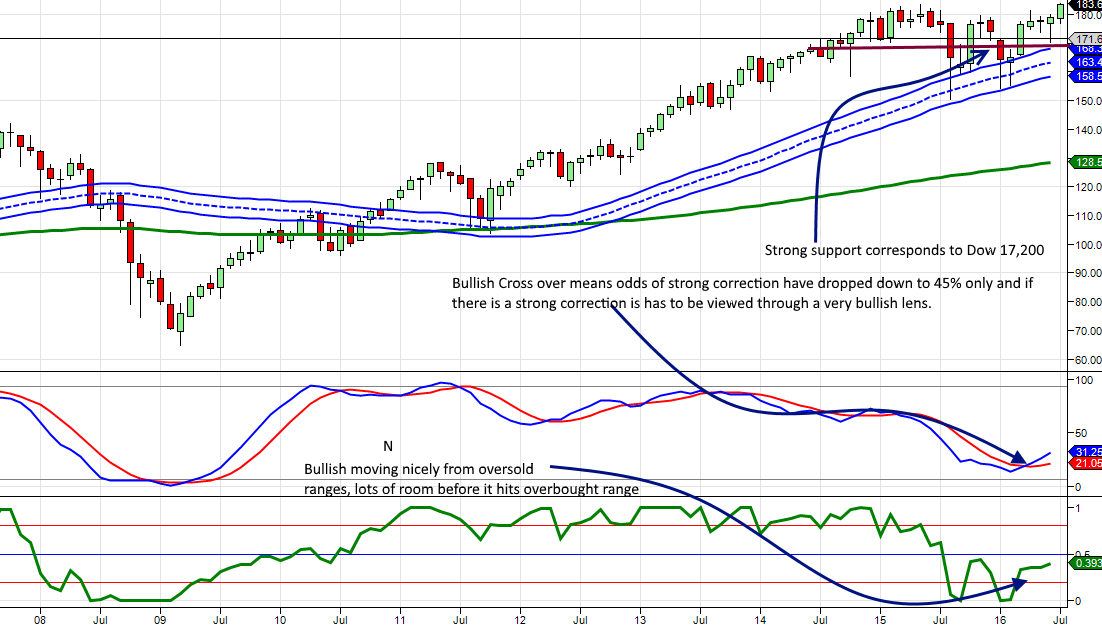
The market’s resilience during this period illustrated just how powerful a tool the trend indicator can be—and how dangerous it is to fight against it. Even though everything seemed lined up for a pullback, markets stubbornly refused to cooperate. The long-term pattern continued improving. Looking at this chart, one would think the Dow and overall market were oversold—unbelievable, but it was what it was. We never fight the trend.
Gold Trade Update: Reading the Signals
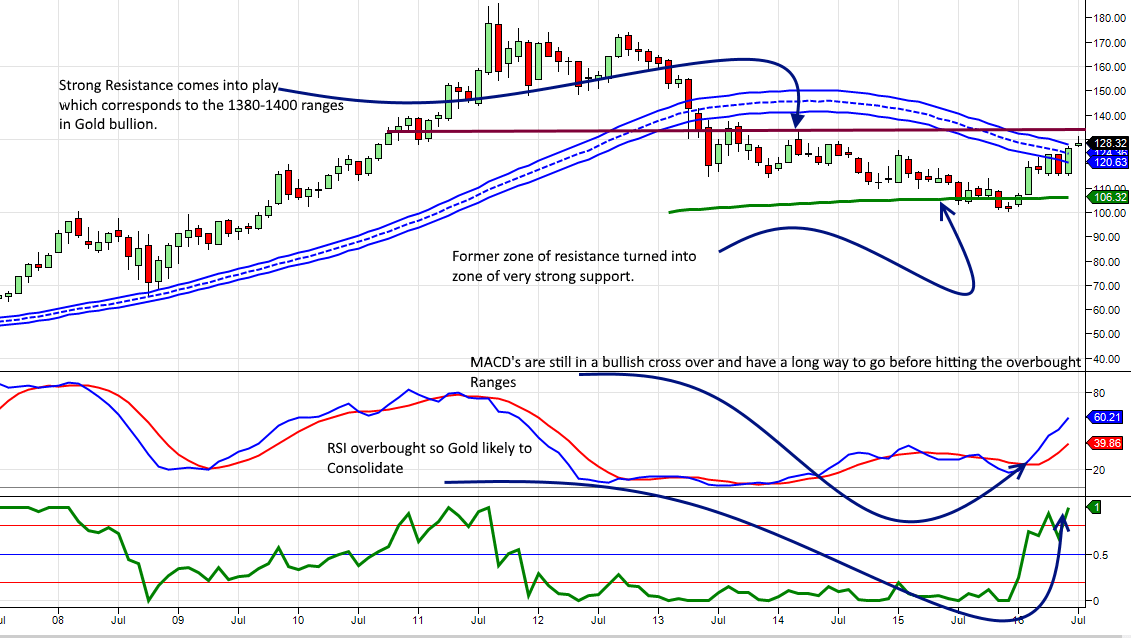
Gold had been treading water, presenting a rather dismal picture compared to oil. While oil continued trending higher, Gold struggled to trade past $1,300. May 17th, 2016 Update
While the move in gold bullion was fairly typical, the same couldn’t be said for gold and silver mining stocks. They experienced extreme upward moves that seemed disconnected from the underlying metal. Something appeared off—these stocks had experienced such decisive action, yet gold bullion hadn’t even made it past $1,400. The stock prices seemed more reflective of gold trading north of $1,650.
Unusual Patterns Emerging in the Gold Market
Gold did something somewhat unexpected during this period—it rallied in the face of a rising dollar. This could be construed as a long-term signal that gold was decoupling from the dollar and trading upward on its own merits. The biggest surprise came from gold stocks, which mounted ferocious rallies while gold bullion failed to trade at levels that would justify such prices.
Perhaps this action resulted from overreaction during the Brexit process, with the actual Leave vote triggering additional fears. Whatever the reason, the move was strong, and congratulations were due to those who played it well. The trend wasn’t positive at the time, but we learned something valuable from watching several markets. If the trend is neutral but several custom indicators are trading in extremely oversold ranges and about to experience bullish crossovers, some calculated risk is worth taking.
Let’s see how the stock GOLD reacts after testing its old highs. With the pattern strong and MACDs along with several other indicators trading far from overbought ranges, gold would probably trade to $1,450 before hitting solid resistance. Those willing to accept some risk could use strong pullbacks in gold bullion to open positions in gold stocks.
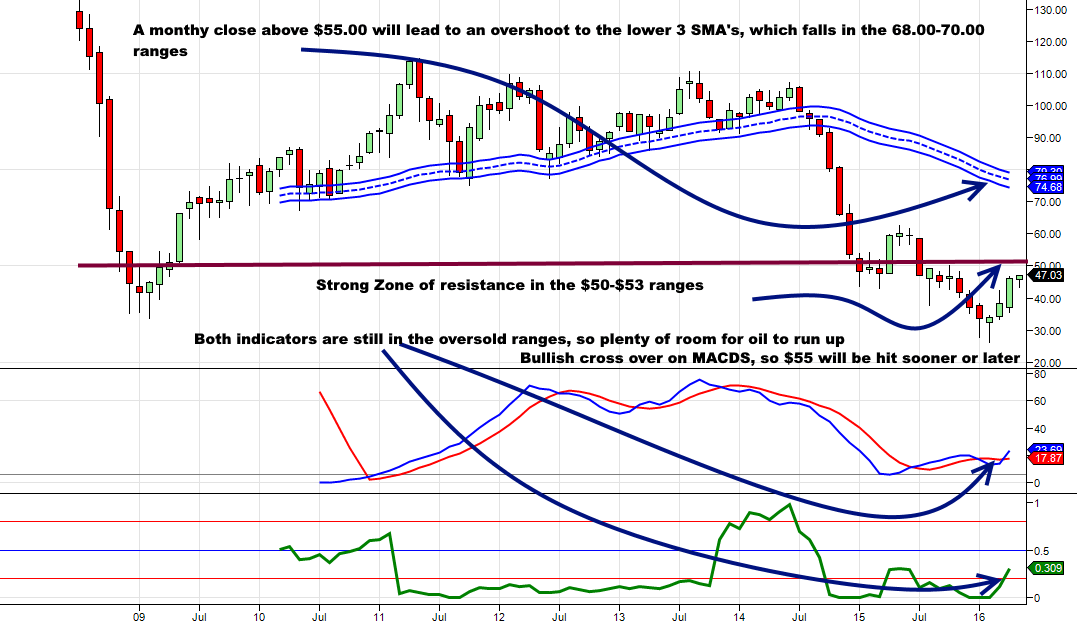
Oil Market: Following the Projected Path
Oil continued following our projected path with near-perfect execution—contrast the action in oil to that of gold. The trend moved from neutral to positive quickly, which was a rather interesting development. However, the score wasn’t very high; normally, the trend swings into the extreme bullish zone. We had a mildly bullish trend, suggesting we should wait for weekly chart indicators to move into oversold ranges again, or for oil to let off steam and shed at least $10.00. May 17th, 2016 Update
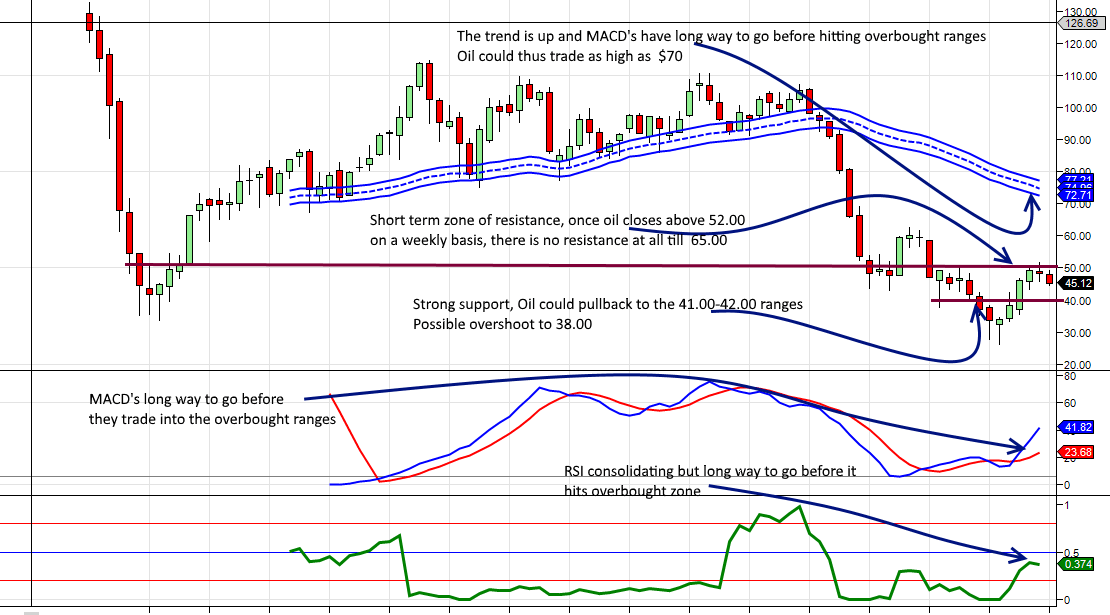
A monthly close above $55.00 would virtually guarantee a test of the $65.00 range with a possible overshoot to $70.00. The trend had strengthened, and we might get the $10.00 pullback we sought. On that note, stocks like PZE and a few others were showing signs of strength during the pullback, prompting us to reevaluate our decision to close out positions.
We had a bullish crossover on the custom MACD, so $55.00 would be hit at minimum, though we didn’t expect this to happen in one shot. Oil was overbought on a weekly basis, so it was ready to consolidate. May 17th, 2016 Update
Oil traded almost to $52.00 before pulling back, missing our $55.00 target by just three dollars. To be fair, we had suggested oil wouldn’t hit this target in one shot, so the consolidation was setting the foundation for a potentially more decisive move.
Turkey: Additional Opportunities Emerging
The trend remained neutral on Turkey but was inching closer and closer to the bullish zone.
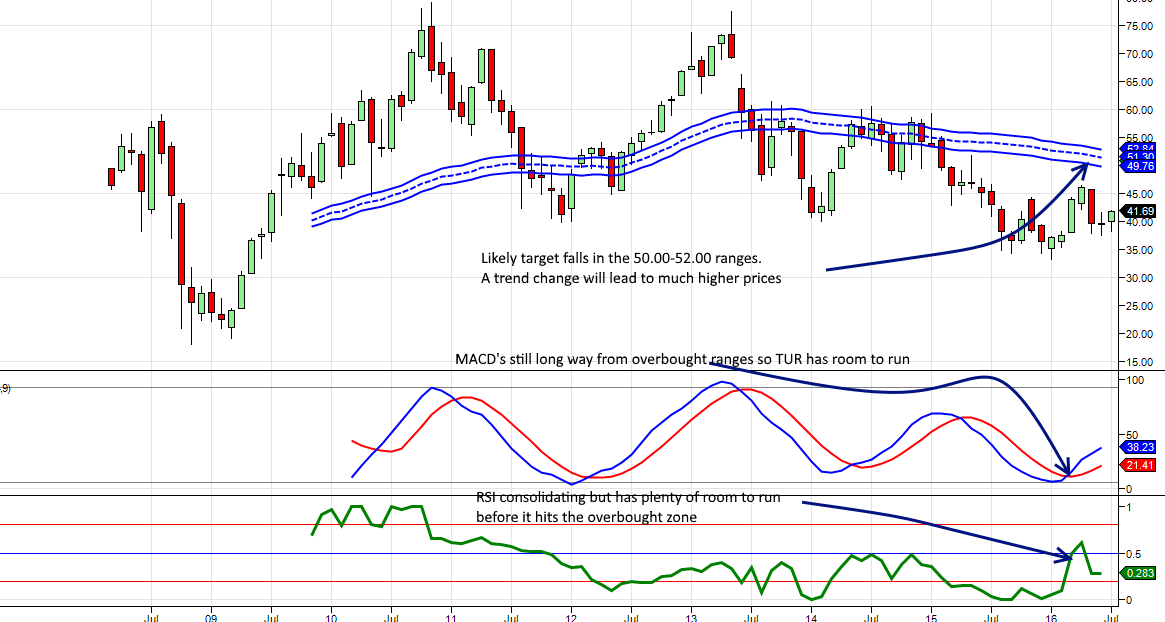
Some funds could be deployed at current levels, with additional capital reserved for a possible test of the $35.00-$36.00 range. Note these are suggested entry points; you can fine-tune them to suit your trading style. May 17th, 2016 Update
Getting in at $38 or better should have been straightforward for those who followed our suggestion. The stock was trading up nicely, and all pullbacks should be viewed as buying opportunities for those willing to accept some risk. We use the word “risk” only because the trend hadn’t turned positive. Another way to play Turkey was via the leading telephone company Turkcell (TKC). Traders could look to open positions at $9.00 or better and use strong pullbacks to add to their position. The stock could trade as high as $12.00 before encountering resistance.
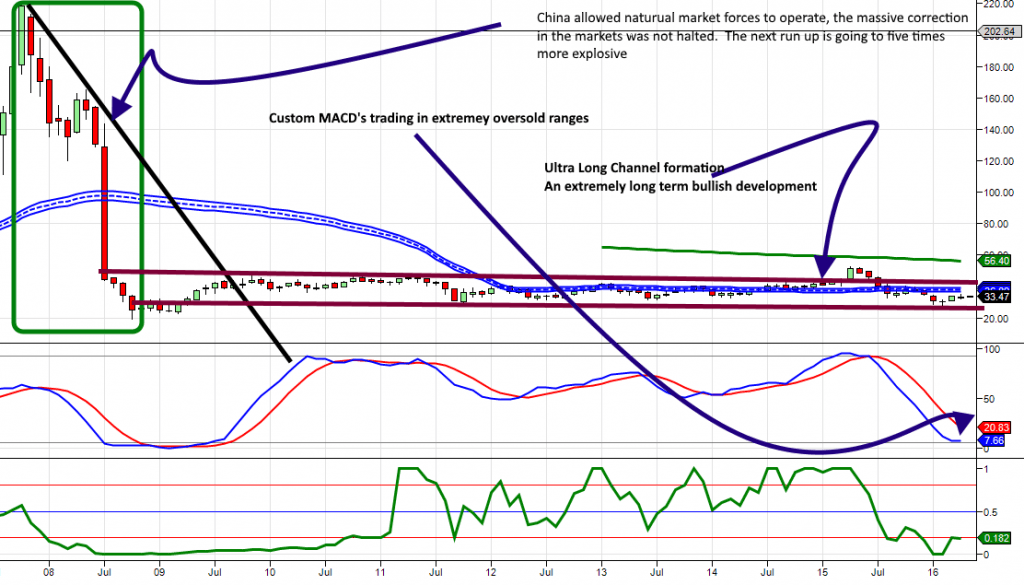
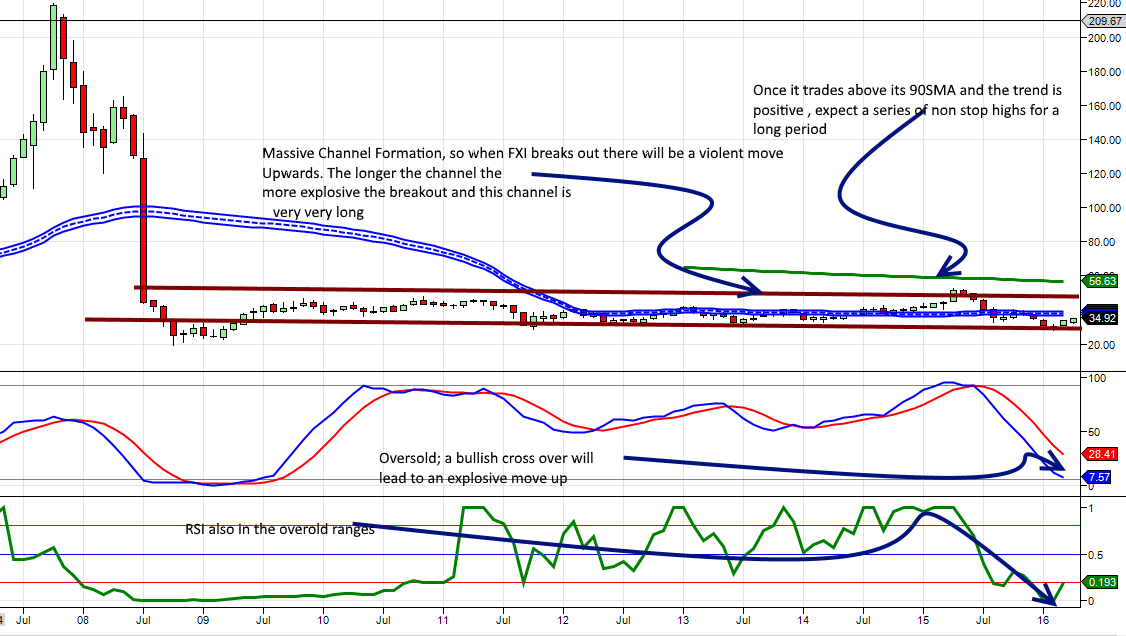
China: The Massive Channel Formation
One thing that jumps straight out at you is the massive channel formation. This channel is extremely impressive because it’s taking place on a monthly chart. If you want to retire a millionaire or you don’t want your kids trapped in the 9-to-5 rat race, the moment the trend turns positive, keep using every pullback to load up on Chinese stocks. From April 14th, 2016 Update
The massive channel formation—roughly nine years in the making—was one of the most significant channel configurations we had ever seen. When the trend turns positive, expect huge moves.
Dow Analysis: Volatility Ahead
The sentiment was somewhat bullish, with anxiety levels lower, but we also had many individuals in neutral territory—indicating considerable uncertainty remained. The trend on the SPX refused to turn positive and remained stuck in neutral. This meant one thing only: expect huge volatility that summer. April 14th, 2016 Update
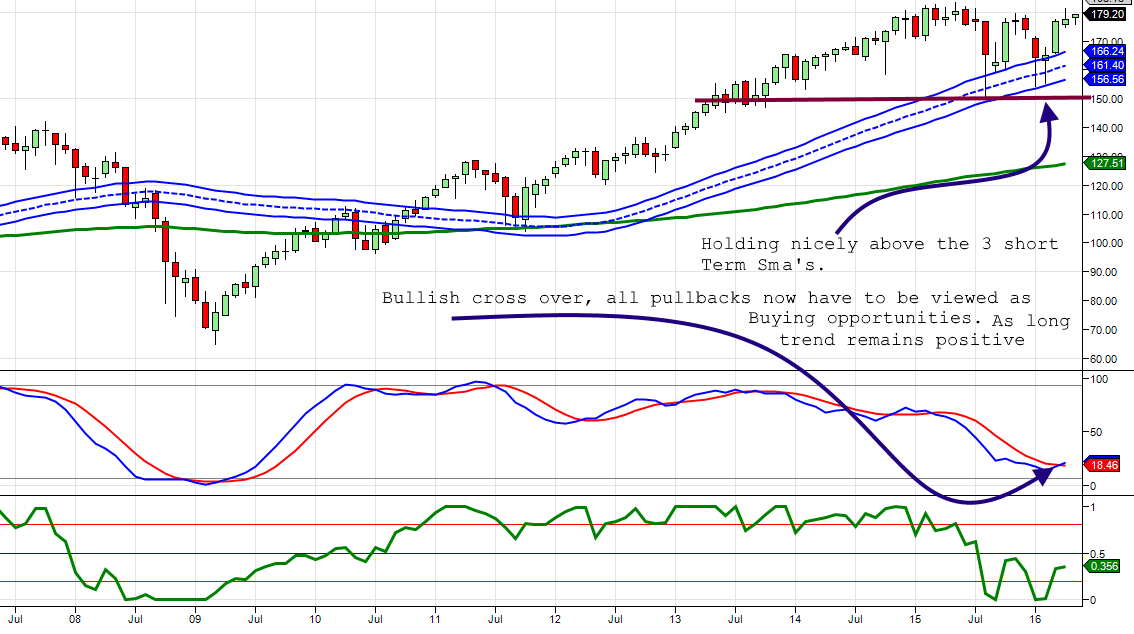
The weekly charts were trading in overbought ranges, so a nice consolidation or decent correction on the weekly charts would make for a splendid buying opportunity. There was no need for a sharp correction, even though we would gladly embrace one. Our weekly indicators needed to move into oversold ranges, and the trend showed no signs of changing.
Gold Sector: Patience Required
Overall, we expected gold to paint a false picture of a perfect breakout; however, unless the trend turned positive, this breakout would fail and send shockwaves through the ranks of gold bugs. One negative factor: the dollar traded to new six-month lows, but gold couldn’t trade to new six-month highs. This indicated that unless the trend turned positive, no matter how strong gold rallied, all rallies would ultimately fail. April 14th, 2016 Update
Gold hadn’t done much, and the picture was rather dismal compared to oil. Oil continued trending higher while gold struggled to trade past $1,300.
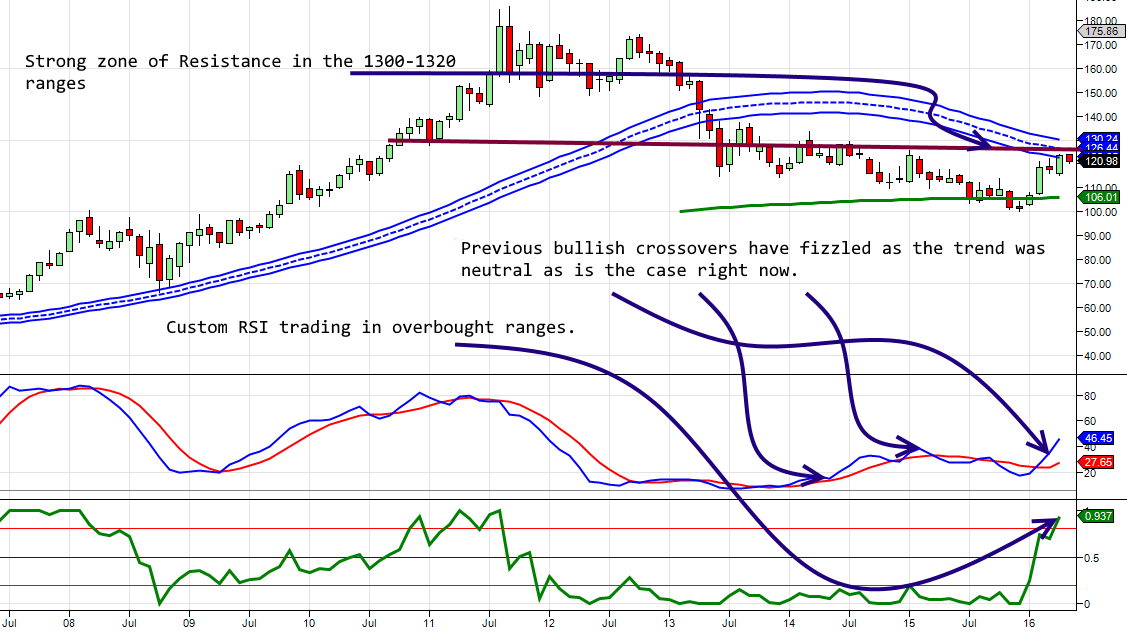
As we had stated before, we weren’t pessimistic about gold, though whenever we published an article hinting that all wasn’t well, gold bugs attacked us like rabid dogs. We viewed this as a positive development—hope springs eternal, and stubbornness knows no limits. Until the trend turned positive, we didn’t care what experts said about how high gold would trade. The trend remained neutral, so the odds increasingly favored a sudden and intense pullback, especially as the dollar appeared to strengthen.
Oil: The Trend Turns Positive
The trend had turned neutral, and oil—as we stated—followed the projected path and bottomed in February. It also pulled back to the $35.00 range as projected before trading past $41.00 and was now attempting to make its way to the $45.00 range. Against this backdrop of gloom and doom, oil prices bottomed, illustrating that euphoria and panic once more serve no purpose but to draw you one step closer to the cliff’s edge. April 14th, 2016 Update
We had a bullish crossover on the custom MACD, so $55.00 would be hit at minimum, though we didn’t expect this in one shot. Oil was overbought weekly, so it was ready to consolidate. The long-term outlook remained bullish and more so now that the trend had turned positive. It took considerable time for the trend to change—a clear sign that this market was being heavily manipulated. The oil crash had been engineered; extreme manipulation was on display. The idea was to take oil down as fast as possible.
Our indicators needed to move into oversold ranges on the weekly charts, or oil needed to shed at least $10.00 before we would jump in. Three solid stocks to consider: PZE, MRO, and TRP; for those seeking big names, XOM was a good option.
China: The Opportunity of a Lifetime
From a long-term perspective, we stuck by our call that any level below 3000 made for an excellent entry point. However, given that we were in what would be remembered as the most volatile year on record, we had to expect markets to overshoot both to the upside and downside. Taking this extreme volatility into consideration, the SSEC had to hold above 2500 on a weekly basis. If it closed below this level weekly, we were looking at a possible overshoot to the 2250 range. At that point, if you have the money, consider backing up the truck. At 2250, China would represent the opportunity that gold at $300 did back in 2003—and long-term subscribers will remember how we were pounding the table on gold back then. February 29, 2016 Market Update
One thing that jumps straight out at you is the massive channel formation. This channel is extremely impressive because it’s taking place on a monthly chart. If you want to retire a millionaire—or you don’t want your kids stuck in the 9-to-5 rat race—the moment the trend turns positive, keep using every pullback to load up on Chinese stocks.
China’s stock market would eventually explode and trade to levels never seen before. Note: China’s middle class had become the world’s largest. More individuals in China had $50,000 in assets than in the U.S. China also had the most billionaires in the world at that point. The middle class would embrace the stock market in the next upward wave, so you could expect a feeding frenzy the world had never witnessed. Those willing to take on more risk could purchase LEAPS on top stocks. One such stock was NTES.
The Lessons That Endure
Looking back at these 2016 market analyses from our current vantage point in 2026, the patterns and principles remain remarkably consistent. Mass psychology continues to drive markets to extremes in both directions. The trend indicator continues proving its worth as a tool for navigating volatility. And the importance of patience—waiting for oversold conditions in strong trends—remains the cornerstone of successful contrarian investing.
The specific stocks and price levels have changed dramatically over the past decade, but the underlying methodology has proven its value time and again. Those who learned these lessons in 2016 and applied them consistently have been rewarded handsomely. Those who ignored them—chasing momentum at tops and panicking at bottoms—have learned the hard way that history does indeed repeat itself for those unwilling to study it.