Has Chaos Returned? Comparing 2008’s Crash Chart to 2022
April 8, 2025
History Doesn’t Repeat, But It Rhymes in Panic
Why do most investors still walk straight into the fire despite every warning? In 2008, the market didn’t just correct—it imploded. Trillions were erased, liquidity frozen, and sentiment shattered. Fast-forward to 2022, and while the catalysts shifted—from subprime contagion to inflation shock and interest rate whiplash—the behavior remained eerily familiar.
Investors, once again, ignored the friction building beneath the surface. High-flyers from 2020 and 2021 were paraded as invincible. New narratives rose. Old caution died. Then the charts snapped, again. Not because people couldn’t access data, but because emotion hijacked logic. What matters is not the cause—it’s the pattern. And the pattern repeated.
2008: Where Fantasy Collapsed Into Freefall
By late 2007, cheap credit and synthetic securities scaffolding groaned under its own weight. Then came the fracture. In the 2008 chart, you don’t see a single clean drop—you see a staircase of delusion. Each bounce felt like salvation. Each collapse felt like betrayal. But none of it was random.
The anatomy of that crash was mathematical: lower highs, broken support levels, volume spikes on red days. But under that, the psychology was pure denial. Institutions clung to models that no longer applied. Investors screamed “oversold” as if that changed the math. The market didn’t care. It hunted leverage and feasted on the overconfident.
Capitulation came only after hope was extinguished. Smart money didn’t predict the exact bottom. They waited for exhaustion—the moment when everyone else gave up. Then they acted. Not emotionally. Strategically.
2022: Echoes, But in a Different Frequency
The wreckage in 2022 wasn’t triggered by housing. It was born from policy reversal and speculative gluttony. Tech darlings, crypto rockets, meme stocks—all rode stimulus-fueled highs. But when inflation surged and central banks punched the brakes, those parabolic charts snapped like cheap plastic.
The 2022 chart showed similar damage with different triggers: momentum lost, trendlines violated, and volume chasing exits. Investors defaulted to hopium: “We’ve dropped so much, a bounce is due.” But charts don’t negotiate. The gambler’s fallacy met a hard ceiling.
What 2022 exposed was fragility disguised as innovation. The bubble wasn’t in one sector—it was in belief. Valuations outpaced fundamentals. Sentiment became the asset class. And when reality returned, everything that had no weight floated into the fire.
Parallel Structures, Divergent Origins
2008 was built on structural rot. 2022 was built on speculative excess. But both were bound by one vector: unsustainable confidence. Markets stretch when narratives expand faster than facts. When liquidity dries or velocity stalls, the illusion rips.
In both cases, the herd leaned in just before the turn. You see it in volume patterns. You see it in RSI divergences. And you hear it in the chatter: “This dip is different.” That’s the inflection point—not the chart, but the delusion that it can’t break further. That’s when it always does.
Reading Between the Lines, Not Just the Charts
Technical analysis without context is noise. In 2008, the sell-off respected no trendline. In 2022, moving averages became exit ramps, not support. Traders who relied on past behavior without recalibrating to new conditions got shredded.
Instead of reacting to lines on a screen, the sharper move is to vector through sentiment, liquidity, and time decay. You don’t need to predict the trigger—you just need to sense when belief outruns reality. That’s the signal. The crash is just the lagging indicator.
The Psychology of Collapse Is Constant
The asset class is irrelevant, whether housing, dot-coms, crypto, or AI. The psychological cycles are fixed: euphoria > denial > anxiety > panic > capitulation > acceptance > boredom > accumulation. 2008 and 2022 followed this arc, with unique inputs but identical outputs.
When prices fall and narratives crumble, only two groups thrive: those who panic early, and those who don’t panic at all. The latter are dangerous. They wait. They stalk. And when blood floods the streets, they buy—not randomly, but with conviction and clarity.
Beyond Recency: Framing the Future
2025 may rhyme with both years, but it has its meter. AI mania, geopolitical risk, and shadow leverage may be the next fuse. Or maybe not. It doesn’t matter. What matters is pattern recognition and the ability to detach from noise.
The edge is not in reacting faster—it’s in reacting smarter. In seeing the feedback loops before they snap. Realizing that the chaos you fear is often just the market normalizing distortions.
Mass Behavior: The Heart of Market Crashes
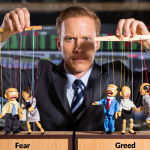
Data don’t drive booms and busts—people drive them. Greed dominates during euphoric rallies; panic drives mass liquidation once markets tumble. Despite endless cycles of this, most investors still fall for it. Why? Because when everyone around you is making easy money, skepticism feels like heresy. And when screens bleed red, fear crushes reason.
2008 was denial wrapped in subprime optimism. 2022 was tech euphoria turned doubt. The surface changed, the psychology didn’t. Crowd belief in “can’t-lose” sectors flipped into a rush for exits once cracks appeared. Traders repeat the cycle not because they forget, but because emotion overrides memory.
Cognitive biases—recency, herd instinct, overconfidence—shape reactions more than facts. Technical charts expose this in real-time: divergence, exhaustion, distribution. Ignore the noise. Read the tape.
Technical Signals: Cracks in the Armor
Charts don’t predict the future, but they reflect the present with brutal honesty. Ahead of 2008, financials cracked early—breaking supports, bleeding on down volume, lagging indices. In 2022, tech stocks showed the same signs: lower highs, rising distribution, weakening RSI. Media still pumped optimism. The tape told the truth.
Key support breaks, volume surges, divergence on major indicators—these aren’t noise. They’re tells. Smart traders don’t chase dips or bottoms; they watch for structure, for confirmation, for when risk-reward actually makes sense.
Strategic Buying and Selling: The Hard Truth
Some of the biggest gains are made in chaos. 2008’s legends didn’t buy randomly—they bought durable companies at peak fear, using both valuation and signal-based timing. 2022 offered similar chances in select beaten-down sectors.
The trap? Emotional inertia. Holding losers too long and panicking out of winners too early. Good strategy isn’t timing perfection; it’s about spotting inflection points and acting decisively. Drying volume, capitulation wicks, broken trends—these are the real cues, not headlines.
Rethinking the Cycle
Every bubble ends. Every collapse reverts. The pattern is universal. What matters is your positioning when the tide turns. Stay liquid when markets lose structure. Step in when asymmetry returns.
Discipline beats prediction. Protect capital when uncertainty peaks. Deploy when clarity emerges. The next storm will come—it always does. Whether you’re ready depends on whether you’ve learned to read beyond the noise.
Conclusion: Chaos Is a Signal, Not an End
Chaos isn’t a bug—it’s a feature. It’s the purge that resets irrational excess. Those who read it correctly don’t fear it—they prepare for it.
2008 gave us a template. 2022 gave us the echo. What comes next? That depends on who’s watching the tape and who’s hypnotized by the headlines.
Be the one who watches. Not the one who wails.
The market remembers. Even when people don’t.