
DJU Index: Decoding Signals – Is it Flashing Bullish or Bearish in the Market?
Feb 21, 2024
Introduction: Intriguing Developments in the DJU Index
The Dow Jones Utility Average (DJU) Index, a price-weighted average of 15 utility stocks traded in the U.S, is a critical market indicator. It often provides valuable insights into the sentiments and potential movements within the equity markets. Recently, intriguing signals have flashed on the DJU charts, suggesting bullish tendencies despite an overall bearish market sentiment.
One such signal is the positive divergence on the weekly charts. A positive divergence occurs when the price of an asset is moving lower, but a technical indicator, such as the relative strength index (RSI), starts to move higher. This divergence can signal that the downward trend is losing momentum, and a bullish reversal might be on the horizon. For instance, despite the DJU’s downward trend in mid-2021, the RSI started to climb, indicating a positive divergence. Shortly after, the DJU saw a significant upward movement, validating the divergence signal.
Another crucial observation is that the DJU is oversold on the monthly charts. An oversold market condition often implies that the selling activity has been overdone, and a reaction, or even reversal, might be due. Historical patterns have shown that when the DJU is oversold, it tends to indicate higher prices for equities over the subsequent 6-9 month period. For example, in late 2018, the DJU was significantly oversold, followed by a robust rally in the equity market in 2019.
Dow Utilities Update: Positive Divergence Signal Triggered
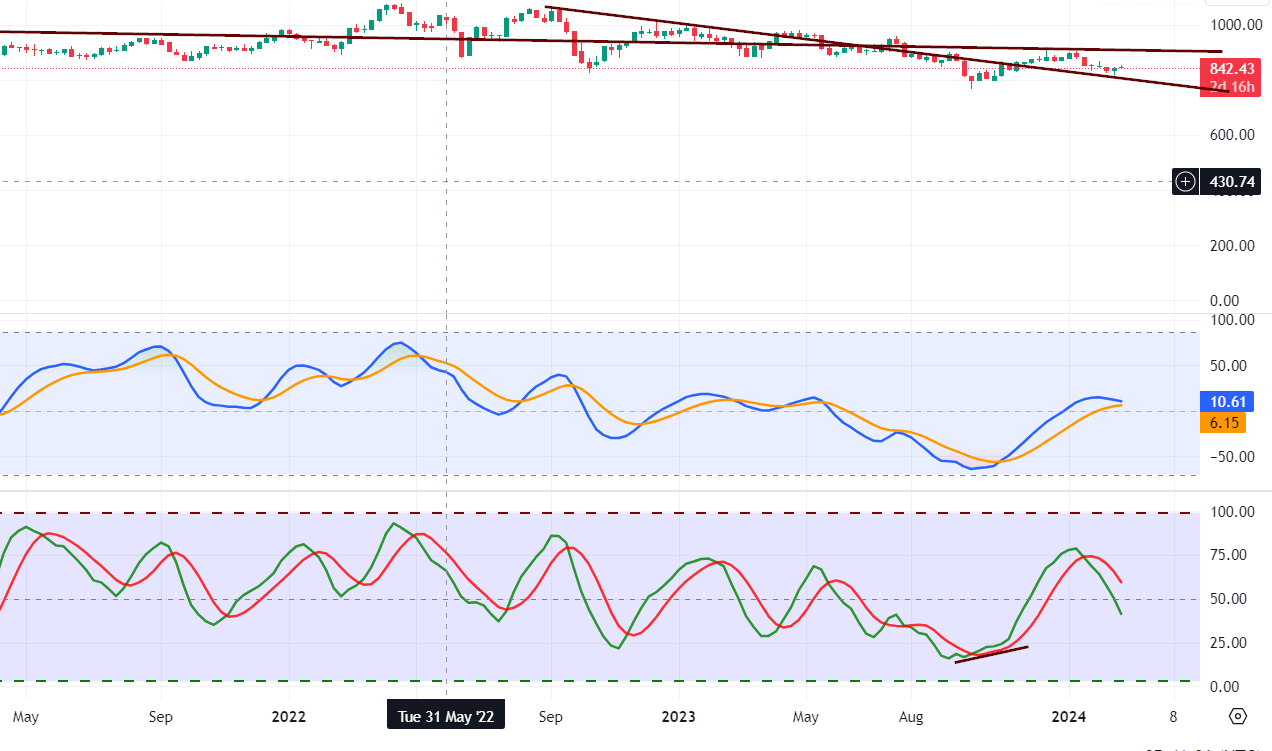 The DJU has produced a substantial positive divergence signal on the weekly charts. Although not as potent as a positive divergence signal on the monthly charts, it suggests that we should welcome any significant pullbacks until one of the following events takes place.
Short-Term and Long-Term Perspectives on IDU and DJU Indices
- Until the trend changes, however, the short-term trend won’t change for at least several weeks, and that’s the only thing that could change. The long-term trend would take months to change. Looking at historical records, the intermediate trend is unlikely to change for at least six weeks.
- IDU surges to the 86 to 90 range or DJU to the 990 to 1002 range. At that point, the situation would need to be re-examined to determine if the pattern on the monthly charts changed. The odds of the pattern changing are relatively low as the Dow Utilities are trading in the highly oversold zone on the monthly charts, as evidenced by the above chart.
Conclusion
In closing, the DJU Index is currently portraying cautious optimism. Key indicators, such as the positive divergence signal on the weekly charts and the oversold condition on the monthly charts, suggest a potential shift towards bullish sentiment. However, remaining patient and vigilant is crucial, as immediate, short-term trends may not drastically alter in the upcoming weeks.
The more gradual, long-term trend, typically unfolding over several months, underscores the importance of maintaining a balanced perspective. Historical data from previous years demonstrates a pattern where oversold conditions on the DJU often precede periods of rising equity prices, lending support to the current bullish outlook.
Keeping a close eye on the IDU and DJU indices will be integral, particularly for identifying specific range movements. A shift in patterns on the monthly charts would necessitate a thorough reassessment of the market outlook. Despite the possibility of change, the prevailing data suggests that Dow Utilities is currently situated in a highly oversold zone on the monthly charts, which has traditionally signalled a pending upward shift in equity prices.
A calculated and strategic approach is recommended when navigating prospective market transitions. A successful investor can skillfully balance immediate tactical manoeuvres and a strategic, long-term game plan.
Mental Treats For The Mind

US dollar vs Japanese Yen: No Bottom In Sight For Yen

ChatGpt vs Google bard: A Poetic Showdown

How to Make Organic Tortillas: A Step-by-Step Guide

De-Stress Meaning: Discover the Art of Relaxation
Stock Market Predictions 2023:Unveiling Market Trends

The Rich Get Richer and the Poor Get Prison

Recession: Best Time to Invest in Real Estate

The Banksters Club: Weapons of Mass Destruction Agenda

Fiat Fun: Unveiling the Source of Problems

How Often Should You Shower
The Free Market System Is Dead: The Fed Killed It

Why the US Medical System is Broken?

Define Fiat Money in Economics: The USD is A prime example

United States Sanctions on Russia: Pressuring Europe to Comply

Financial Instability: 40% of Americans Can’t Handle $400 Emergencies
When is the Next Bull Market: Unveiling Post-Crash Opportunities
