
Understanding the Kansas City Financial Stress Index: A Comprehensive Guide to Assessing Market Risk and Opportunity
February 15, 2023
The Kansas City Financial Stress Index (KCFSI) is a measure of financial market stress in the United States, and it has long been a topic of interest for investors, economists, and market observers. The index was created in the early 1990s by the Federal Reserve Bank of Kansas City and has since become a well-respected barometer of market stress. In this post, we will explore the KCFSI and its relevance to market bottoms and tops, taking a contrarian and academic approach.
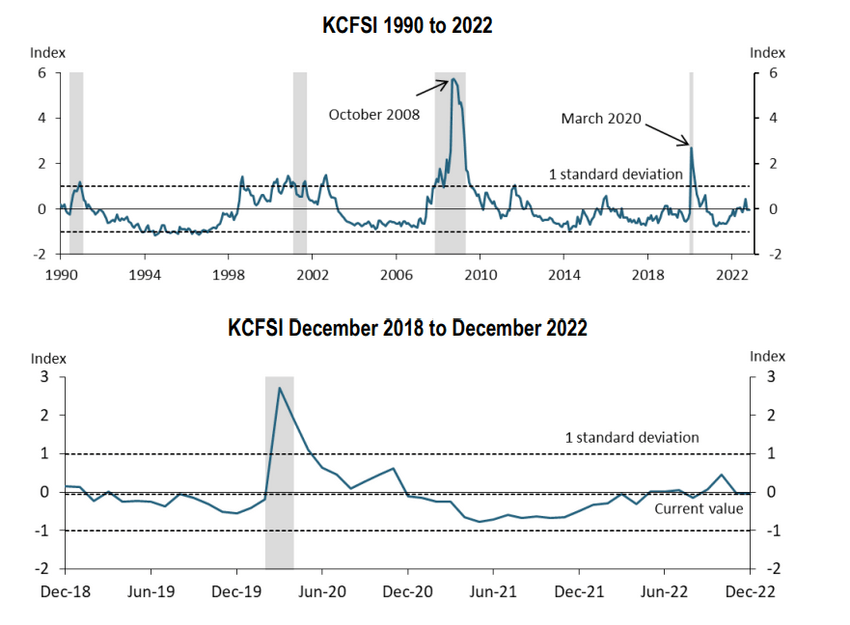
The KCFSI is a composite index of 18 different financial market indicators that are combined to give a single number that reflects the current level of financial market stress. The indicators used in the index include measures of interest rate volatility, credit spreads, and market liquidity. The higher the KCFSI reading, the greater the level of financial market stress, and vice versa.
The KCFSI is a reliable Indicator of Market Stress.
The KCFSI has been a reliable indicator of market stress over the years, and it has a good track record of predicting market bottoms and tops. Market bottoms are characterized by a high level of financial market stress, which is reflected in a high reading on the KCFSI. Conversely, market tops are characterized by a low level of financial market stress, which is reflected in a low reading on the KCFSI.
Several factors contribute to market bottoms and tops. One of the most important is investor sentiment. When optimistic about the future, investors are more likely to take on risk and buy equities, which drives up stock prices and creates a market top. When pessimistic about the future, investors are less likely to take on risk and sell equities, which drives down stock prices and creates a market bottom.
Another factor that contributes to market bottoms and tops is interest rates. When interest rates are low, investors are more likely to take on debt and invest in equities, which drives up stock prices and creates a market top. Conversely, when interest rates are high, investors are less likely to take on debt and sell equities, which drives down stock prices and creates a market bottom.
Using the Kansas City Financial Stress Index (KCFSI) to Identify Market Turning Points
The KCFSI can also be used to identify market turning points. A turning point is a change in the trend of a financial market, and it can be a sign of a market bottom or top. The KCFSI can be used to identify market turning points by looking for changes in the level of financial market stress. If the level of stress is rising, this is a sign that a market top is approaching. However, extreme readings, as shown above, always indicate an imminent bottom, and vice versa.
Of course, other factors contribute to market bottoms and tops, but the KCFSI is a good starting point for anyone looking to understand the underlying drivers of financial market stress. The KCFSI is a valuable tool for investors and market observers. It provides a comprehensive view of financial market stress and effectively identifies market bottoms and tops.
FAQs
What is the Kansas City Financial Stress Index (KCFSI)?
The KCFSI is a composite index of 18 different financial market indicators that measure the level of financial market stress in the United States.
Who created the KCFSI?
The KCFSI was created in the early 1990s by the Federal Reserve Bank of Kansas City.
What factors contribute to market bottoms and tops?
Investor sentiment and interest rates are two important factors that contribute to market bottoms and tops.
How can the KCFSI be used to identify market turning points?
The KCFSI can be used to identify market turning points by looking for changes in the level of financial market stress. If the stress level is rising, this is a sign that a market top is approaching. However, extreme readings, as shown in the KCFSI, always indicate an imminent bottom and vice versa.
Why is the KCFSI a valuable tool for investors and market observers?
The KCFSI provides a comprehensive view of financial market stress and effectively identifies market bottoms and tops.
Other Articles of Interest

Define Sentiment: Unveiling the Power of Emotional Intelligence in Investing

Hyperinflation Definition: It’s Elementary

Stock Market Monthly Trends: How to Profit from Market Cycles
US bond Market & The Dollar

Forever QE on steroids

Tactical Investor past market calls

Dow Jones Trend: Markets Poised to Soar Higher?

The Trend Blazer Service

Dow Trends 2021 & The Market of Disorder

Stock Portfolio Tracker with Analytics

Public Education Trends: The Silent Crisis

Stock sentiment and Market sentiment Charts

Flow of Funds: Contrarian Opportunities & BTC Market Insights

Long Term Trends Equates to focusing on the trend