Define Sentiment: The Power of Emotional Intelligence in Investing
Updated Jan 2023
Let’s define sentiment: an attitude, thought, or judgment prompted by feeling. This is the general definition of sentiment.
So, let’s define sentiment as it relates to the markets. When it comes to the market’s investor sentiment falls under three categories, bullish, neutral and bearish. When investors are bearish, contrarian analysis indicates that buying is the best option and vice versa.
Mass Psychology and sentiment are going to be the dominant forces in this market. Market Update September 11, 2021
This appears to be the case so far. All the experts and retail investors are both expecting a severe correction. Yet, when we tabulated the latest data a few days ago, bullish sentiment dropped to a number that one would typically associate with a crash.
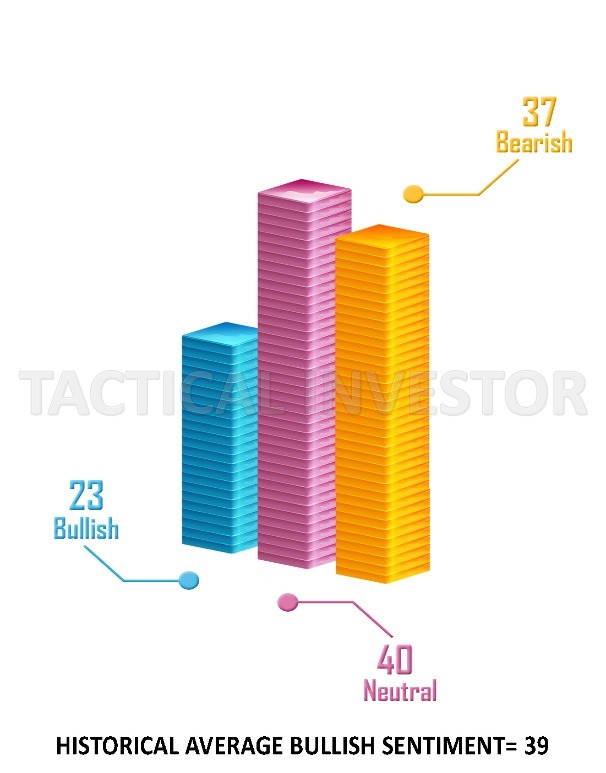
However, bullish sentiment has never remained above 39, even for two weeks in a row. It surges past 39 and then abruptly pulls back. This is a very revealing development, for it indicates that the dominant emotion in the markets is uncertainty. Market Update September 11, 2021
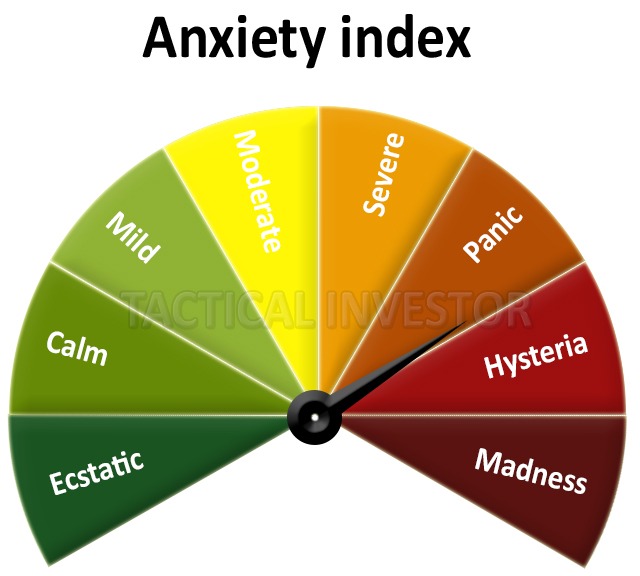
The markets are still trading close to their historical highs, so such a low bullish reading would appear to be unbelievable. However, pay close attention to the number of individuals in the neutral camp. Neutral readings rose to 41 and are two points above bearish readings, indicating that uncertainty is the dominant emotion at play. The gauge on the anxiety index has now moved to the panic zone. Regardless of what the experts state, the only option is to embrace sharp pullbacks until the Trend changes. Presently the trend is showing no signs of weakness.
Historical Sentiment values
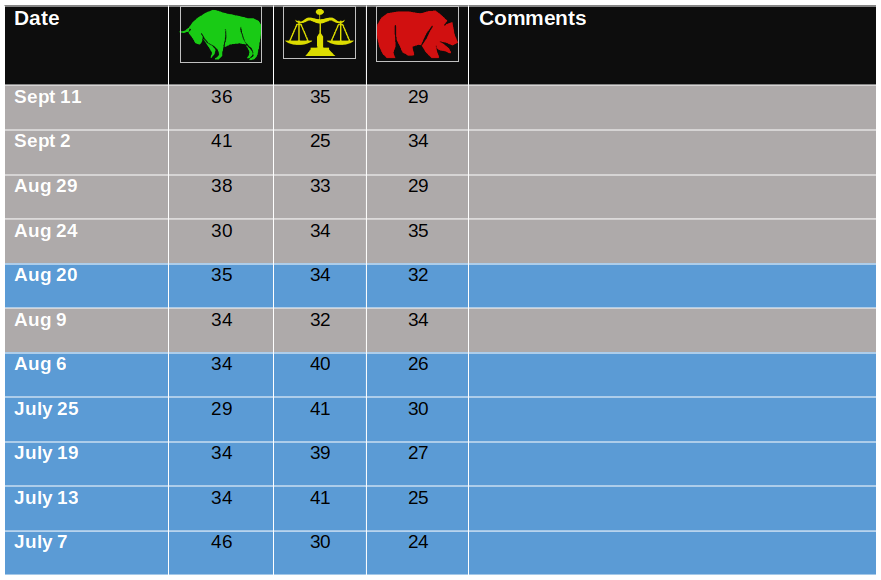
When we include the current readings with the data above, the same saga continues. There has not been one episode where bullish readings traded past their historical average for even two weeks in a row. In fact, the current reading of 20 is a new multi-month low. This clearly indicates that the label “Market of disorder” was aptly chosen. From a conventional perspective, nothing that is taking place makes sense. And as we predicted over 24 months ago, this market will confound all the experts of yesteryear, for they continue to rely on tools that no longer work. Since 2009, but notably since 2015, we have placed less and less emphasis on the tools we utilised before (especially on Tools that used to work before 2009). More emphasis has been placed on Mass Psychology. If the current trajectory continues, anyone hoping to stay on the right side of the market will have to understand that MP should account for at least 84% of their analysis.
If this theme continues, then we can come up with the following hypothesis:
This market is going to experience a correction in two waves. The first wave will be a head fake, the intent being to confuse both the bulls and the bears. The bears will short the markets aggressively during the first downward phase, while the bulls lighten up and wait for the markets to trend lower so they can get better prices. The markets will suddenly reverse course and surge higher. For fear of missing out, the bulls will jump in and pay more. The bears will panic and close their shorts, and then the markets will experience the real correction and shed at least 15%. If this hypothesis pans out, it should occur in two stages. Market Update September 11, 2021
Minor correction: Sept to Oct
Stronger correction: Jan to Feb 2022
We are still not out of the woods, but if the correction does not pick up steam, then a ton of weak bulls (over 60% of bullish are fakes) will jump back in and start buying aggressively. This in turn, will force the bears to cover their shorts. Overall, there is a good chance that the Dow could be trading in the 37K ranges within the next few months.
Then when everyone assumes the path forward is clear of obstacles, the markets will shed a hefty dose of steam, laying the foundation for the next upward move. One should never forget that 90% of traders don’t have what it takes to deal with a sharp correction. If they did, they would fall into the elite category of super traders, to which less than 3% of traders can lay claim. These traders don’t trade frequently. They relax and enjoy life, and trading is a game for them. They focus on the big picture. In other words, they focus on the trend; everything else is just noise.
We have heard nothing that deserves anything but a rudimentary glance over the past three weeks. The Evergrande Group scandal, the Federal Reserve raising rates, the record margin debt, and other negative news trending into the equation. It’s all noise, plain and simple. The markets have not let out a nice dose of steam for a while. The Dow shedding 3% to 6% would fall under the minor correction scenario.
Our modified indicators (RSI and MACD) are both trading in the slightly oversold ranges on the weekly, which is quite remarkable given that the Dow is still trading near its highs. If the MACD experiences a bullish crossover, the odds are pretty high that the Dow could tack on 2400 to 3000 points from its current trading range. Market Update September 23, 2021
Support: Minor support in the 33,600 to 34,080 ranges. As long as this is not broken on a weekly basis, the short-term outlook will remain bullish.
A strong level of support comes into play in the 30,900 to 31,500 ranges.
Resistance: 34,800 to 35,100 ranges. A monthly close above 34.8K (preferably above 35.1K) should lay the foundation for the Dow to test the 37k ranges.
Conclusion
The ideal scenario would be for the Dow to rally to the 34,800 to 35,400 range and then experience a sharp short plunge to the 33,600 to 33,900 range. If these levels hold, it should be able to mount a strong reversal taking out the 35,400 ranges in record time and positioning itself for a test of the 37K ranges (plus or minus 600 points). The second scenario is that it continues to trend higher from current levels. This will lead to an even more pronounced correction next year.
While we have outlined potential scenarios, Tactical Investors should focus most of their attention on one factor. The trend is positive, so whatever strategy the fearmongers, experts, jackasses, etc., try to use to con the masses, ignore them and focus on the trend.