


Unveiling Dow’s Rise: Stock Monthly Trends Uncovered
Updated Oct 2023
The GP (Gnosis Panoptes) Index keeps experiencing mini surges. It has undergone three significant moves in less than 30 days (a very unusual development as the last time such a wave was experienced was over 90 days). If it experiences one more surge, we can state the odds of all hell breaking loose will surge significantly. The Rage Discontent index reached a new high, and V readings are at an all-time high. Hence, a strong reaction is all but given; the only question remains how strong this reaction will be and if this reaction will occur outside or within the markets.


Outside the markets implies massive upheaval, possibly a mini civil war. Such an event will eventually impact the markets. We live in exciting times, and at this stage of the game, it is imperative to take the observer’s role; do not wear your emotions on your sleeves. If you do, it means the feelings are in charge, and you are just a mindless bot begging for the beating of your life. Since the inception of time, the masses have been emotional players. Their only function has been to serve as punching bags and cannon fodder. Try as hard as you might. It is impossible to change this equation. Still, it is possible to escape the mass mindset if one chooses to do so.
Stock Market Monthly Trends Signal Near-Term Top
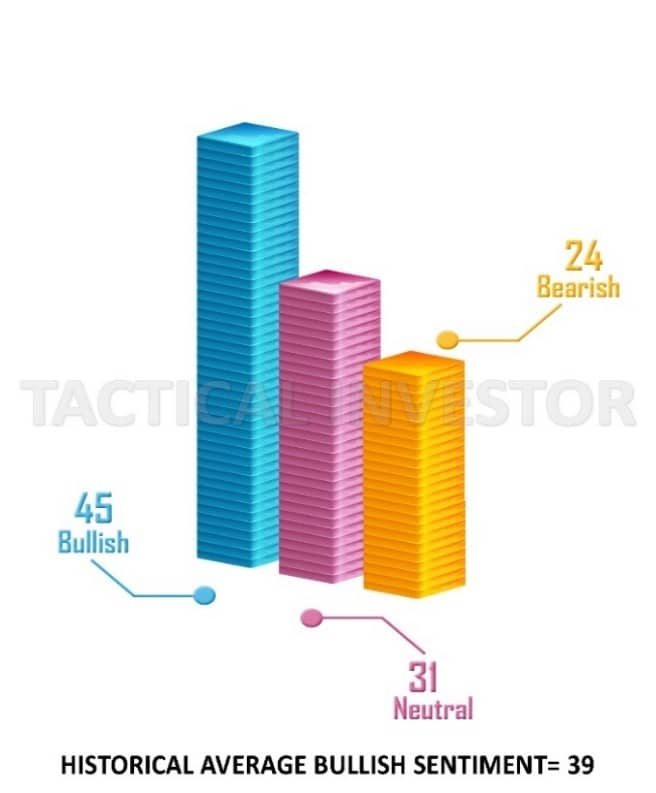
Bullish sentiment is moving up and down but trading within a narrow ban. This suggests that sentiment readings could experience a blow-off top somewhat similar to market tops, which inadvertently would indicate that a market top is near. As this is an unusual market, we suspect this Yo-Yo action will continue until Bullish sentiment surges past 60. Examined from a different angle, Neutral and bearish players still overwhelm the bulls. Hence, the markets will likely trend upward until the bullish sentiment score exceeds the combined Neutral and Bearish scores. Market update Dec 21st, 2020

Random Wisdom for Investment Success: Mass Psychology and Contrarian Strategies for Lasting Gains
Cracking the code for successful investments involves comprehending mass psychology and adopting contrarian principles to secure long-term profits. Mass psychology underscores the importance of resisting herd mentality and recognizing market extremes, while contrarian investing provides a rational approach amid market fluctuations.
Reflecting on past experiences adhering to naysayers and supposed experts led to financial upheavals. The term “expert” transforms into “EX Spurt,” a relic of bygone days. True wisdom lies in adapting to the market and employing strategies grounded in understanding, discipline, and forward-thinking.
Rather than fixating on today’s top-performing stocks, the focus should be on companies with robust fundamentals acquired at opportune moments. Successful investors maintain a long-term perspective, seizing opportunities during corrections or bearish phases.
In summary, the most lucrative long-term stocks often operate away from the spotlight. They present sustained growth potential, frequently undervalued due to market shifts. Grasping mass psychology, embracing contrarian strategies, and concentrating on a stock’s long-term viability pave the way for informed decisions, resulting in future rewards. Wealth accrues in the stock market over time, not through hasty gains.
Conclusion
On the weekly charts, the MACDs have experienced another bullish crossover. This setup will likely usher a test of the 1300 to 1350 ranges, with a possible overshoot to 1450. If the Nasdaq trades past 1350 on this leg, then the likelihood of a substantial correction would surge to the 70% range. A sentence in the 15% to 19% range is more likely than a correction in the 9 to 11% range. Market Update Dec 21st, 2020
The Nasdaq pulled back firmly in March 2021, setting the stage for a multi-week and possibly multi-month rally. Unless the trend changes, all sharp sell-offs should be embraced at this game stage. Current stock market monthly trends are bullish, validating that all sharp sell-offs should be viewed through a bullish filter.
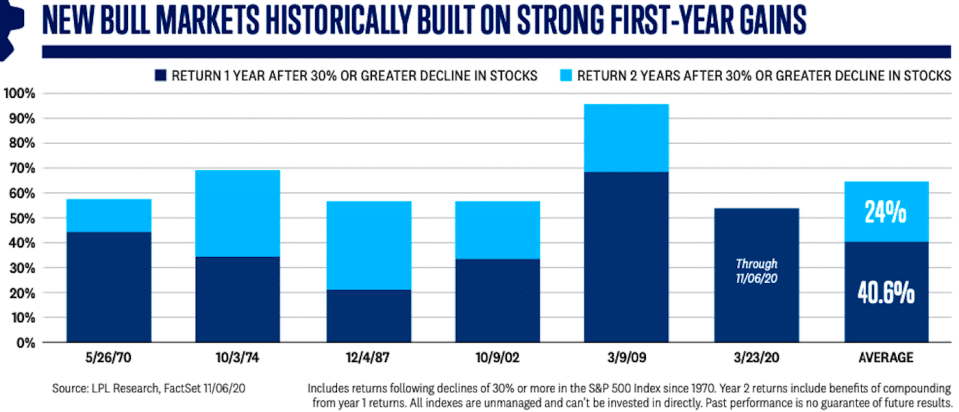
The new bull market started roughly in March (based on conventional analysis). Hence, it will end in March 2022, plus or minus three months. Based on this data and mass psychology, this bull still has the energy to run before it drops dead.
In conclusion, as we unveil the rising trends in the stock market, particularly within the Dow and the GP Index, it becomes evident that we are navigating through intriguing and potentially volatile times. The GP Index’s frequent mini surges and the unusual three significant moves within a month raise anticipation for a potential upheaval. The Rage Discontent index hitting a new high and V readings reaching unprecedented levels only intensify the expectations for a robust reaction, leaving us to ponder whether it will manifest within or outside the markets.
The possibility of upheaval outside the markets, akin to a mini-civil war, adds a layer of complexity to the financial landscape. It emphasizes the need for an observer’s role, detached from emotional biases. Emotions, when in control, reduce us to mere pawns in the larger scheme of market dynamics. While the masses historically succumb to emotional play, there remains an opportunity for individuals to break free from this mindset.
Transitioning to market trends, the monthly signals indicate a potential near-term top. The fluctuating bullish sentiment within a narrow band hints at a blow-off top reminiscent of market peaks. The yo-yo action is expected to persist until bullish sentiment surpasses 60, indicating a shift in market dynamics. The update from December 21, 2020, serves as a reminder of the market’s unusual behaviour, with bullish sentiment needing to outweigh the combined neutral and bearish scores for a sustained upward trend.
Amidst these market fluctuations, the wisdom for investment success lies in understanding mass psychology and embracing contrarian strategies. The historical pitfalls of blindly following experts underscore the importance of adapting to the market with informed, disciplined, and forward-thinking approaches. Grounded in robust fundamentals, shifting focus from immediate gains to long-term potential provides a more sustainable investment strategy.
Originally Published on April 26, 2021, and Enhanced in October 2023
Beyond Basics: Engaging Stories Await


The Fear Factor is what Propels Investors to Panic at the Wrong time
Perception Is The Key To Everything-If used correctly
