Investor Sentiment Index Data: The Path to Success or Failure?
Updated April 21, 2024
Investor sentiment plays a crucial role in understanding market dynamics. As Sol Palha from TacticalInvestor.com emphasizes, mass psychology is a vital driver of market movements. Positive sentiment can lead to bullish trends, while negative sentiment can trigger sell-offs. “The theory of Paradoxes states that over-applying oneself in the wrong direction brings about the opposite desired result,”Palha notes.
Monitoring sentiment indicators like surveys, media coverage, and options data can provide valuable insights. “Bearish sentiment has to spike, and markets usually bottom when almost everyone has given up on the market,”** Palha observes. Contrarian thinking is essential, as extreme bullishness may signal overvaluation, while excessive bearishness could indicate buying opportunities.
As Charles Munger wisely stated, “The whole secret of investment is to find places where it’s safe and wise to non-diversify. It’s just that simple.” Investors can identify these opportunities by understanding sentiment and applying contrarian principles.
Utilizing the Investor Sentiment Index for Profitable Investing
The Investor Sentiment Index is a powerful tool that combines mass psychology and technical analysis to determine market turning points. **”Our team identifies potential support and resistance levels by analyzing market sentiment, mass psychology, and technical analysis, and confirms market trends while managing risk effectively,”
Unlocking wealth secrets lies in embracing the allure of mass psychology for financial triumph’ Sol Palha
As Mark Twain humorously remarked, **”Whenever you find yourself on the side of the majority, it is time to pause and reflect.”** Contrarian thinking challenges conventional wisdom and uncovers hidden opportunities. By daring to think differently, investors can navigate the market more effectively.
Incorporating the wisdom of great thinkers like Archimedes, who declared, “Give me a lever long enough and a fulcrum on which to place it, and I shall move the world,”** investors can leverage the power of sentiment analysis to make informed decisions. As Solon, the ancient Athenian statesman, advised, “In all things, moderation is best,” a balanced approach that considers sentiment alongside fundamental and technical analysis is critical to long-term success.
Interpreting Bullish and Bearish Sentiment
Bullish and bearish sentiments significantly influence investment decisions. The bullish sentiment reflects optimism, with investors expecting rising prices and profits. Bearish sentiment indicates pessimism, with investors anticipating declines and losses.
The Investor Sentiment Index provides insights into prevailing market sentiment. High bullish sentiment suggests optimism, potentially leading to increased buying and upward price pressure. Conversely, pronounced bearish sentiment signals pessimism, which can trigger selling pressure and downward movements. However, contrarian investors may view excessive bearishness as a buying opportunity, as markets might be oversold and undervalued.
As Warren Buffett famously said, “Be fearful when others are greedy, and greedy when others are fearful.” This contrarian approach aligns with sentiment analysis, seeking opportunities when sentiment reaches extremes.
Contrarian Investing and Sentiment Analysis
Contrarian investing involves going against prevailing market sentiment. It assumes that when most investors are overly optimistic or pessimistic, the market may be nearing a turning point. Contrarian investors aim to identify opportunities by taking the opposite position of the crowd.
Sentiment analysis, including the Investor Sentiment Index, is valuable for contrarian investors. By monitoring sentiment indicators, they can identify situations where market sentiment has reached extremes. For example, the CNN Fear & Greed Index, which measures investor sentiment based on various market indicators, can provide insights into market sentiment. A reading above 80 indicates extreme greed, while a reading below 20 suggests extreme fear.
Contrarian investors may consider reducing exposure to overvalued assets or taking short positions when sentiment is excessively bullish. Conversely, when sentiment is extremely bearish, they may identify undervalued assets and take long positions, anticipating a market reversal.
As Sir John Templeton, a renowned contrarian investor, stated, “Bull markets are born on pessimism, grow on scepticism, mature on optimism, and die on euphoria.”
Integrating Investor Sentiment with Technical and Fundamental Analysis
Combining investor sentiment analysis with technical and fundamental analysis can provide a comprehensive investment strategy. Technical analysis examines historical price patterns and market data to identify trends and trading opportunities. By integrating sentiment analysis, investors can confirm potential trend reversals indicated by technical patterns, such as double tops or bullish engulfing patterns.
Fundamental analysis evaluates an asset’s intrinsic value based on economic and financial factors. Incorporating sentiment analysis can help gauge the impact of sentiment on market valuations. For example, suppose a company appears undervalued based on financial metrics, but sentiment analysis reveals excessive bearishness towards the stock. In that case, it may suggest a misalignment between market sentiment and fundamentals, presenting a contrarian opportunity.
As Benjamin Graham, the father of value investing, noted, “The intelligent investor is a realist who sells to optimists and buys from pessimists.”
Behavioral Finance and Investor Sentiment
Behavioral finance explores how psychological and cognitive biases influence financial decision-making. Investor sentiment analysis aligns with behavioural finance principles, aiming to understand and quantify the emotions and biases driving investor behaviour.
Emotions like optimism, pessimism, fear, and greed can significantly impact market dynamics. The Investor Sentiment Index captures these emotions among market participants. Behavioural biases, such as herd mentality, confirmation bias, and overconfidence, can also affect investor sentiment.
Understanding behavioural biases and their impact on investor sentiment can help investors navigate market inefficiencies. Investors can make more rational and disciplined investment choices by being aware of common biases and incorporating sentiment analysis.
As Daniel Kahneman, a Nobel laureate in economics, stated, “The idea that the future is unpredictable is undermined every day by the ease with which the past is explained.”
Investor Sentiment Data: Navigating Bullish and Bearish Markets
Investor sentiment, reflected in bullish and bearish outlooks, significantly influences market dynamics. Bullish sentiment indicates optimism, with investors expecting rising prices and profits. Conversely, bearish sentiment reflects pessimism, with investors anticipating declines and losses.
The Investor Sentiment Index provides valuable insights into prevailing market sentiment. High bullish sentiment suggests optimism, potentially leading to increased buying and upward price pressure. For example, the CNN Fear & Greed Index, which measures investor sentiment based on various market indicators, can provide insights into market sentiment. A reading above 80 indicates extreme greed, while a reading below 20 suggests extreme fear.
Contrarian investors may view excessive bearishness as a buying opportunity, as markets might be oversold and undervalued. As Warren Buffett famously said, “Be fearful when others are greedy, and greedy when others are fearful.” This contrarian approach aligns with sentiment analysis, seeking opportunities when sentiment reaches extremes.
Integrating Sentiment Analysis with Technical and Fundamental Approaches
Combining investor sentiment analysis with technical and fundamental analysis can provide a comprehensive investment strategy. Technical analysis examines historical price patterns and market data to identify trends and trading opportunities. By integrating sentiment analysis, investors can confirm potential trend reversals indicated by technical patterns, such as double tops or bullish engulfing patterns.
Fundamental analysis evaluates an asset’s intrinsic value based on economic and financial factors. Incorporating sentiment analysis can help gauge the impact of sentiment on market valuations. For example, suppose a company appears undervalued based on financial metrics, but sentiment analysis reveals excessive bearishness towards the stock. In that case, it may suggest a misalignment between market sentiment and fundamentals, presenting a contrarian opportunity.
Behavioral finance explores how psychological and cognitive biases influence financial decision-making. Investor sentiment analysis aligns with behavioural finance principles, aiming to understand and quantify the emotions and biases driving investor behaviour. Emotions like optimism, pessimism, fear, and greed can significantly impact market dynamics. The Investor Sentiment Index captures these emotions among market participants.
Understanding behavioural biases and their impact on investor sentiment can help investors navigate market inefficiencies. Investors can make more rational and disciplined investment choices by being aware of common biases and incorporating sentiment analysis. As Daniel Kahneman, a Nobel laureate in economics, stated, “The idea that the future is unpredictable is undermined every day by the ease with which the past is explained.”
Let’s examine one tangible example of how sentiment data can help you stay on the correct side of the market.
Analyzing Investor Sentiment and Market Outlook
April 27, 2023 Outlook
This week’s sentiment data reveals that 35% of investors are in the neutral camp, and an additional 25% are in the Neutral camp, proving that the Crowd is far from bullish. What will it take to turn the crowd bullish? That is an excellent question without a perfect answer. This market falls into the insane category as well, and that is why we have been focusing so firmly on the trend indicator and market sentiment. The technical analysis comes in at a distant third.
Insane individuals have been known to do the unpredictable, which applies to this market. It has defied all expectations. As a further precaution, once our key proprietary indicators ( on the monthly charts) of the DOW, SPX, and Nasdaq start trading in highly overbought ranges, we will take a defensive posture. We have several Market Sentiment Indicators that we rely on to provide us with a clear picture of where the Market is headed.
Mass Sentiment Indicator 1 in action
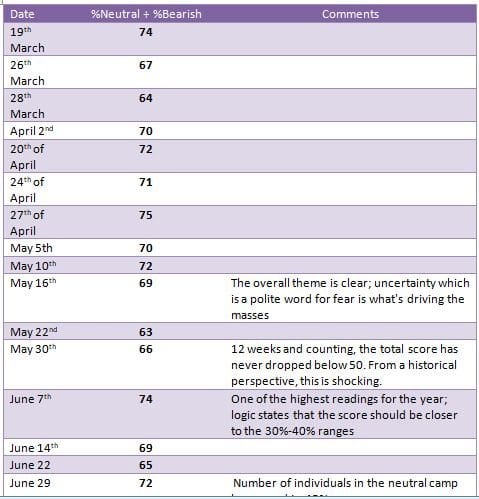
We decided to look at the moving average of one of the Market Sentiment Indicators, and the data below paints an interesting picture. It seems like history is being made as we speak; the market trends are higher, and anxiety levels, instead of dropping, are trending upwards.

Compelling Articles from Various Angles