
Stock Market Crashes: Lessons Learned, Strategies Unveiled
Oct 3, 2022
A study of the stock market crashes in history reveals one upbeat fact: the ones that lost the most were the ones who panicked and dumped their shares at or very close to the bottom. Even more interesting, when one examines stock market crash patterns in history, one finds that those investors who bought shares when blood was flowing in the street made out like bandits.
Let’s look at the crash of 2008-2009
The financial system was under immense pressure in 2008, yet the Fed threw a fraction of the money it threw at the system in 2020. The secondary purpose was to engineer a crash to give the Fed a reason to flood the system with more cash than at any other time in history. The money supply increased by almost 30%. And this brings us to the primary reason. To control the intermediate market trends (12 to 24 months), 90% of investors falsely mistake these timelines for the long-term trend.
In simple terms, an immense opportunity is brewing. But exceptional opportunities mean that one has to be both patient and disciplined. Every decade or so, the markets experience a massive rolling correction, and as of late, the pace has picked up significantly. In the past, there used to be a lapse of up to 20 years between such events.
Investors have been hard-wired to view corrections/crashes as life-ending events. Instead, these long slow, painful corrections pave the way for monstrous gains. Investors can make enough from one of these cycles to retire if they position themselves correctly.
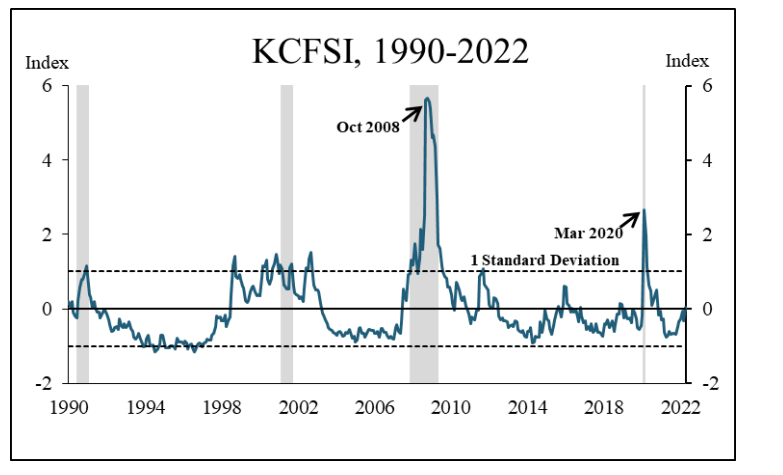
https://www.kansascityfed.org/
Unleashing the Power of MOAB Signals and the Promise of Mind-Boggling Returns
The Kansas City financial stress index provides exciting data for students interested in observing patterns in some of the stock market crashes in history. For example, the index was trading in the stratosphere in 2008, indicating that a powerful correction was close at hand.
However, such events usually lead to a MOAB (Mother of all buys). When a MOAB signal is triggered towards the end of such a phase (remember, a MOAB is not always triggered), the rally period lasts 7X to 10X longer than the corrective phase. If the corrective phase lasted one year, the rally phase would last at least seven years. With the rare FOAB, the rally phase is at least 10X longer. Hence once this corrective phase is over, we will experience a period akin to 2009 to 2020. In simple terms, a period of mind-boggling returns. You have to be in it to win it or out of it to lose it. Most will lose it.
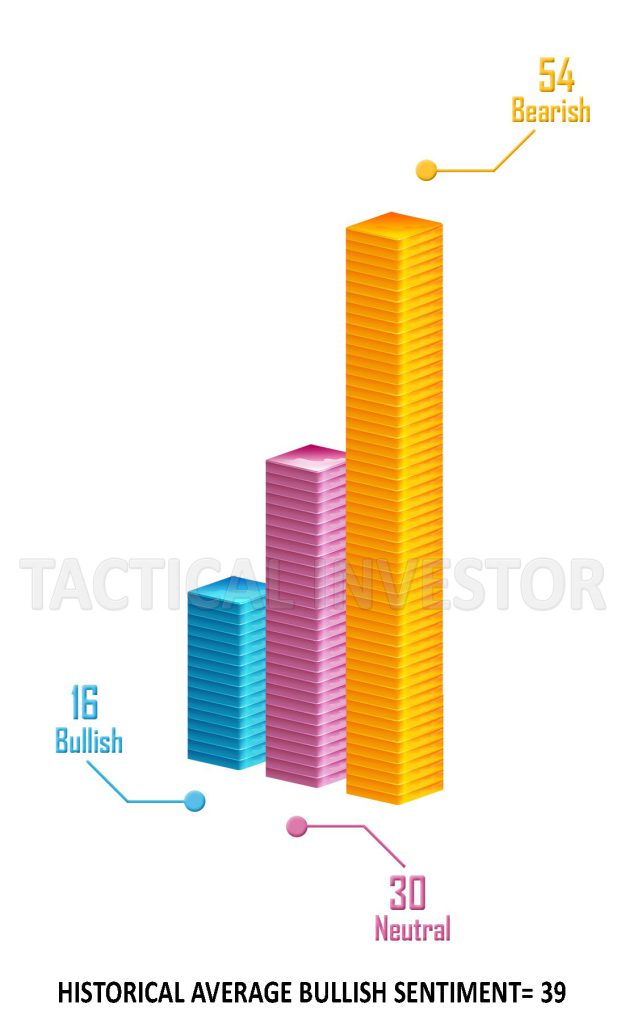
Bullish sentiment is at 16 again, so there is another reason to believe that after this small corrective patch, the markets will trend upwards and smash through crucial resistance points.
Aggressive traders can use daily pullbacks ranging from 380 to 500 points (DOW) to open up additional longs. Do not attempt this if you don’t fall under the high-risk-taker or aggressive trader category. Market update June 29, 2022
Aggressive investors can continue employing the above strategy.
Delightful read: Next Stock Market Crash Prediction: Unveiling Insights and Impacts
Other Articles of Interest
Muslim Migrants unleashed make Sweden Rape Capital of West

Gold as a safe investment: Stocks To Invest In
Central Bankers World Wide embrace race to the Bottom
Mindset The New Psychology Of Success In The Stock Markets
How do negative interest rates work? Destruction of Savers Is Main Side Effect
Currency Wars & Negative Rates Equate To Next Global Crisis
Erratic Behaviour Meaning:Dow likely to test 2015 lows
Central bankers embrace Negative interest rate wars
Market Update Tactical Investor Past Calls: The Trend Is Your Friend