
Stocks to Buy Today Reddit: Exploring Investment Insights from the Online Community
Updated May 1, 2023
In the modern era of digital advancements, online platforms have assumed a pivotal role in providing a wealth of information and fostering discussions on a wide range of subjects, including lucrative investment prospects. Reddit has emerged as a vibrant hub among these platforms, hosting diverse communities where individuals actively share valuable insights, strategic approaches, and up-to-date stock recommendations.
This introductory segment aims to provide a comprehensive overview of the subject, shedding light on the significance of Reddit as a reliable source of investment advice. Furthermore, we will explore the advantages and considerations of delving into stock recommendations sourced from this thriving online community. Throughout our discussion, we will leverage current and historical data to unveil how we have successfully identified key opportunities and anticipated market turning points well before significant events.
Reddit and the Power of Community:
Reddit is an expansive online platform housing numerous subreddits or communities where individuals come together to discuss, share news, and exchange ideas on various subjects. Within specific subreddits dedicated to finance and investing, Redditors actively participate in conversations centred around identifying stocks to consider purchasing in the present day.
While it is important to note that much of the data found on these forums is speculative, akin to the outcome of a coin flip, a valuable opportunity exists when this data is approached from a contrarian perspective. Moreover, by grasping the fundamental principles of mass psychology, one can further enhance their ability to leverage the sentiment observed among these Redditors to their advantage.
Benefits of Reddit for Investment Insights:
While many may argue that Reddit offers several advantages in terms of seeking stock recommendations, there is only one true advantage to be found. This advantage lies in taking a position contrary to the prevailing sentiment expressed by individuals on the platform unless it involves shorting the markets. It is important to note that shorting the markets is a highly speculative endeavour and may not be suitable for everyone. Instead, let’s consider a scenario where Redditors exhibit overwhelming enthusiasm for Bitcoin.
Rather than directly shorting Bitcoin, a more prudent approach would be to consider selling off your position in Bitcoin and exploring alternative investments currently out of favour but showing early indications of a potential trend reversal. For instance, in the current landscape of July 2023, where the AI sector is experiencing a frenzy, a strategic move would involve reducing or closing out positions in AI and redirecting investments towards the industrial sector, which is poised for significant growth.
Now let’s look at investing in the Tactical Investor Way
Spotting Gems
Before attempting to purchase any stocks, one must ensure one is on the right side of the market. If the trend is positive, you can focus on the stocks to buy today issue, but if not, then the stores to buy today factor is moot. You should be moving into cash, or if you are an aggressive trader, you could attempt to short the markets. You should find out what the masses are doing as they are notorious for coming to the party late and overstaying their welcome. Therefore if the crowd has just turned bullish, you can still compile a list of stocks to buy, as the market is doubtful to correct until the crowd turns euphoric.
Focus on companies that have exciting products and that are growing strongly quarterly. For example, try to focus on companies with a quarterly earnings growth rate of 25% or higher. You can use a stock screener to speed up the work. One good place to start is finviz.com. Also, please ignore the experts, who are as lost as the crowd. If they knew what they were doing, they would talk less and invest more; instead, they talk more and invest less and usually sell information on par with rubbish for a fortune.

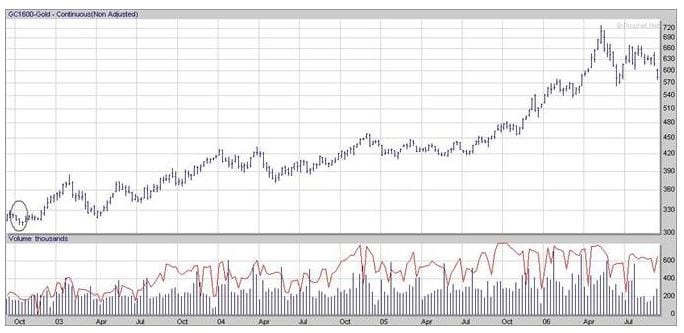
Let’s look at the Gold sector, for example.
Applying the simple concept of pricing the Dow in Gold and Silver as we did in an article titled Dow 1200 Illusion, or we will show you common sense, can go a long way to ensure you are on the right side of the markets.
We will take the low of the Dow over four years and the low that gold put during the same period. As the Dow is priced in Dollars, we will divide the price of gold into the Dow. For the record, we could choose other price points as they only serve to illustrate our point.
In Oct 2002, the Dow traded at 7200 (4-year chart), and Gold traded at roughly 300.
Dow
Gold
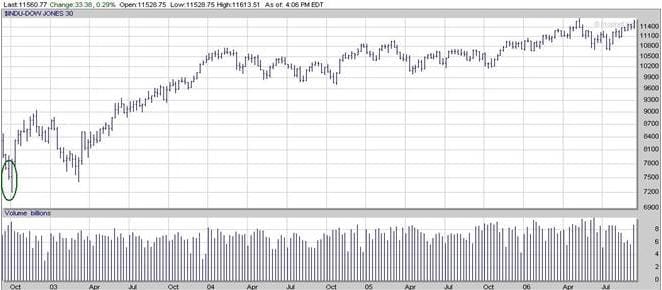
If we divide 7200 by 300 (the price of Gold), we get 24 ounces. It took 24 ounces of Gold to repurchase the Dow in Oct 2002 (remember, we considered the Dow’s lows and not its highs), so it should take at least 24 ounces or more to buy the Dow in 2006. Let’s check that figure out. In May 2006, the Dow put in a new 52-week high and almost tested its old all-time high of roughly 11700. For argument’s sake, we will assume that the Dow traded at 11700 in May. At that time, Gold put in a high of approximately 720.
11700 divided by 720 = 16.25
Back in 0ct 2002, it took 24 ounces to buy the Dow, and at this time, it was trading at a four-year low. This means that the Dow was trading higher back in Oct 2002 than in May 2006, because it took 8 ounces less of Gold to buy the Dow when it was trading at close to a new five years high. For the Dow to break even to its Oct 2002 levels, it would have to be at (24 X 720) 17280.
Historical Purchasing Power of Gold
The Dow only made it to 11700, which means it corrected over 35% as it should be at 17280 instead; it’s below 11700. Market technicians state that we are in a bear market if the market has corrected over 20%. Based on these figures, the Dow corrected around 35%, albeit silently, yet the Dow has just put in a series of new illusory 52-week highs. The market could trade much higher and still be in a (Silent) bear market. The funny part is that the bears are correct, but they don’t know how to use this info, and the bulls are wrong, but at least, for the time being, they are using the information at hand correctly.
This Market is destined to soar to new highs for two reasons. The market has already experienced a substantial correction. Secondly, the function of the Fed is to ensure that markets continue to trend higher. Why? They will continue inflating the money supply to infinity, which entails maintaining a healthy financial system. Or at least it should appear to look healthy. One day the masses will wake up, but we will not hold our breath as that day could be very far into the future. The masses, for now, love “fiat”, and nothing will change that over the next 10-20 years.
Silver outlook
If we use Silver as the constant, the figure we get is even more outrageous, and it suggests that the markets have corrected even more than 35%.
Silver was trading around the 5.15 mark in Oct 2002.
Dow 7200 divided by 5.15 = 1398 ounces
May 06 Silver traded roughly to 15 dollars
1398 X 15= 20970; that’s the level the Dow should be just to equal the level it was trading in Oct 2002 when priced in silver.
This means that the Dow has already corrected a whopping 44.2% yet has put in a series of new 52-week highs. These highs are all illusory and indicate that in the long run, the Dow will be trading much higher than it’s trading today as it has already experienced a back-breaking albeit silent correction.
Since the Dow is priced in dollars lets, perform a final test on the Dow. The Dow hit an all-time high back in 2000 (look at the picture below). To simplify matters, let’s assume the value of this high was 11700 (actually, it’s higher).
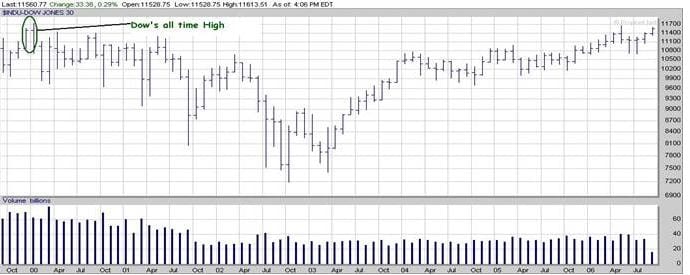
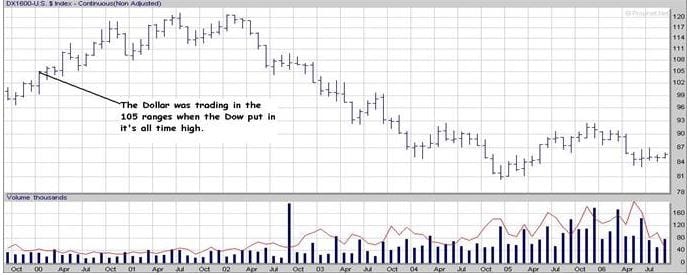
Now let’s look at what the dollar did in the same period. When the Dow put in its all-time high, the dollar index was trading around 105; this is roughly 20 points (currently in the 85 range) lower than where it’s currently trading. On a % basis, it works out to 19.5%. To make things simple, we will round it off to 20. In today’s dollars, the Dow would have to trade 20% higher than the high it put back in 2000 to break even. At this point, the chances of the Dow trading to the 14040 price point level are slim to none. If we were wildly optimistic, we would probably issue a target of 12600.
Stocks To Buy Today or Tomorrow Is A Silly Concept
One could technically state that the market is only experiencing a long-dead cat’s bounce or that we are in a long-term bear that is genuinely invisible for now. Ultimately, one must understand that when dealing with the markets, nothing remains the same forever; those who examine the needs with closed eyes and a closed mindset will find that their wallets enter the empty rather rapidly. This little exercise also very clearly illustrates the evils of inflation.
Buy when the masses panic and sell when they are euphoric; that’s mass psychology 101 for you, and do not focus on the stupid concept of stocks to buy today, as there is a time to buy and a time to sell. There is also a time to do nothing. Focus on the trend, for it’s your friend.
Charts were provided courtesy of prophet finance.

Conclusion:
Exploring stock recommendations on Reddit can be a valuable addition to an investor’s toolkit. The diverse community and real-time discussions on the platform offer unique insights and the opportunity to uncover potential investment opportunities. However, it is crucial to exercise critical thinking, conduct thorough research, and balance Reddit insights with traditional investment analysis to make informed decisions. By leveraging the power of Reddit’s community, investors can expand their knowledge and potentially identify promising stocks to buy today.
Since we can’t know what knowledge will be most needed in the future, it is senseless to try to teach it in advance. Instead, we should try to turn out people who love learning so much and learn so well that they will be able to learn whatever needs to be learned. John Holt 1908-1967, Australian Politician, Prime Minister
FAQ: Stocks To Buy Today Reddit
Q: What is the “Stocks To Buy Today Reddit” concept?
A: “Stocks To Buy Today Reddit” refers to seeking stock recommendations from the Reddit community, where users engage in discussions and share insights on potential stocks to buy in the current market.
Q: Why is Reddit a valuable platform for investment advice?
A: Reddit provides a diverse community of individuals sharing their perspectives and knowledge on stocks. It offers real-time discussions, immediate updates on market trends, and the opportunity to uncover lesser-known investment opportunities.
Q: How should one approach stock recommendations on Reddit?
A: While Reddit can provide valuable insights, exercising caution and conducting thorough research is essential. Due diligence is crucial, as opinions on Reddit can be influenced by biases or personal interests. Reddit should be used as a starting point for further investigation rather than the sole basis for investment decisions.
Q: What factors should be considered when selecting stocks to buy today?
A: It is recommended to focus on companies with exciting products and quarterly solid growth rates, such as those with a quarterly earnings growth rate of 25% or higher. Stock screeners, like finviz.com, can help expedite identifying suitable stocks.
Q: How can one determine if the market trend favours buying stocks?
A: Evaluating the overall market trend before buying stocks today is crucial. If the trend is positive, it is advisable to focus on stock purchases. However, moving into cash or shorting the markets may be more prudent if the trend is negative.
Q: How can one make informed investment decisions amidst market fluctuations?
A: Analyzing historical data and market indicators is essential to understand market movements comprehensively. Monitoring the Dow in relation to Gold or Silver prices can offer insights into the market’s direction. Additionally, understanding the psychological aspect of mass psychology and market sentiment can help in timing entry and exit points.
Q: Should one rely solely on “Stocks To Buy Today” concepts?
A: No, it is essential to focus on the overall trend of the market rather than the concept of buying stocks solely for the present day. Investing decisions should be based on the long-term trend, considering factors like panic selling and euphoria. Timing, trend analysis, and a broader perspective are vital to investment decisions.
Q: What role does inflation play in investment decisions?
A: Inflation can significantly impact market dynamics and the purchasing power of stocks. Understanding the effects of inflation and its influence on market movements is crucial when making investment decisions.
Q: What is the importance of focusing on the market trend?
A: Focusing on the market trend is essential because it provides valuable insights into the direction of stocks. By understanding the trend, investors can identify the opportune time to buy, sell, or stay out of the market. The market trend is a helpful indicator and can assist in making informed investment decisions.
Q: How can one navigate the complexities of the stock market successfully?
A: Navigating the stock market successfully requires a combination of research, analysis, and understanding of market psychology. By following the trend, practising due diligence, and staying informed, investors can increase their chances of making sound investment decisions.


This post is Continuously Updated: Originally Published on July 29, 2015, with the Latest Update in March 2023
Timeless Treasures: Delving into the Historical Article Archives
Why market crashes are buying opportunities
Why Mechanical and Technical Analysis Systems Fail
The Limitations of Trend Lines
Contrarian Investment Guidelines
Inductive Versus Deductive reasoning
Portfolio Management Suggestions
The Good And The Ugly On Trading Futures
I inquired of the wise man, “How did you acquire such profound knowledge?” He responded with utmost confidence, “By always admitting my lack of knowledge and seeking guidance from others.” These words are those of Johann Gottfried Von Herder, a renowned German critic and poet who lived from 1744 to 1803.
