

S&P 500 Stock Market Crash 2008 Chart: Spotting Opportunities Amid the Chaos
Sept 9, 2026
What if the greatest opportunities appear precisely when the crowd sees nothing but disaster? That question sits at the centre of every major market collapse because financial crises do more than destroy capital; they expose the psychological machinery that drives investors to buy aggressively when prices are rising and sell desperately after those same prices have collapsed. The 2008 S&P 500 crash provides one of the clearest examples of this phenomenon, showing how fear, herd behaviour, technical deterioration, and forced selling can push markets far beyond the point at which rational long-term investors should remain paralysed.
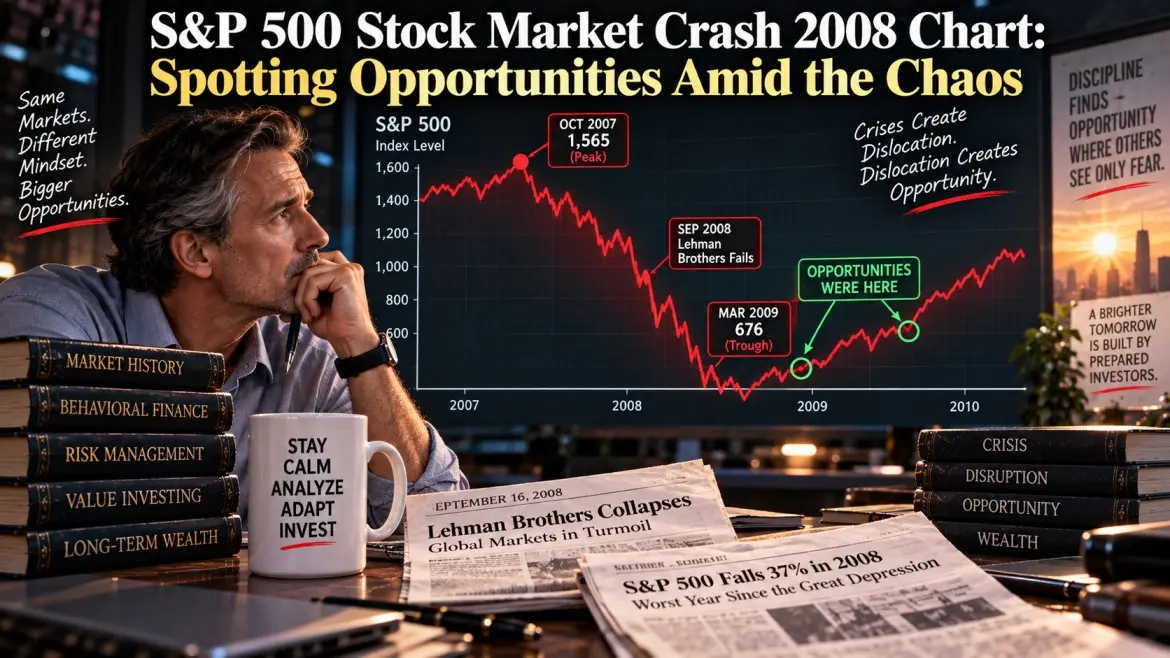
The S&P 500 ultimately fell approximately 57% from its October 2007 peak to its March 2009 low, creating an environment in which financial headlines became increasingly apocalyptic and investors increasingly convinced themselves that further declines were inevitable. The fundamentals were genuinely damaged, particularly within the financial system, but the market’s psychological reaction extended well beyond the initial problem as fear encouraged investors to liquidate positions, which pushed prices lower and generated even more fear. This is the feedback loop of mass psychology, where the behaviour of the crowd becomes an additional force driving the market.
The critical lesson is not that every crash should be bought blindly. It is that extreme declines deserve investigation precisely because emotional selling can create a widening gap between what investors believe will happen and what ultimately happens, and that gap is where contrarian opportunities can emerge.
The 2008 S&P 500 Crash: Mass Psychology at Work
The 2008 crash was a financial crisis, but it was also a psychological crisis. As the housing bubble deteriorated, mortgage defaults increased, financial institutions came under severe pressure, and confidence in the financial system deteriorated rapidly, investors moved from concern to fear and eventually to outright panic. The S&P 500 became a visible expression of that psychological deterioration as selling intensified and participants increasingly responded to falling prices rather than evaluating each security independently.
This distinction matters because falling prices can create their own narrative. Investors see a stock declining 20%, interpret the decline as evidence that something must be seriously wrong, sell the position, and then watch the additional selling reinforce their original belief, creating a self-reinforcing psychological loop. What begins as rational concern can therefore become irrational excess when millions of participants respond to the same information through the same emotional filters.
The crowd’s behaviour was understandable because the crisis was real, but understandable does not mean optimal. Investors who sold everything in an attempt to escape uncertainty often discovered that they had converted temporary market losses into permanent ones, while those who maintained liquidity and selectively accumulated quality assets during the worst of the panic were positioned to benefit when fear eventually subsided.
Warren Buffett’s famous principle, “Be fearful when others are greedy, and greedy when others are fearful,” captures the psychological asymmetry perfectly. The difficulty is that greed feels safe because prices are rising, while buying during panic feels dangerous because every available signal appears to confirm that the market is broken.
Behavioural Biases: Why Panic Selling Hurts
Why do intelligent investors sell after markets have already fallen dramatically? Behavioural psychology provides several answers, including loss aversion, recency bias, herd behaviour, confirmation bias, and the tendency to give excessive weight to information that confirms an existing fear.
Loss aversion is particularly important because the psychological pain associated with losses can become overwhelming during severe market declines. An investor who watches a portfolio fall 30% may become more concerned with preventing another 10% decline than with evaluating whether the assets are now substantially cheaper, and that shift in focus can transform a temporary decline into a permanent loss.
The problem becomes even more severe when investors observe everyone around them making the same decision. Social proof tells them that if millions of other investors are selling, those investors must know something they do not, while financial media provides a continuous stream of negative narratives that reinforces the decision. The result is a psychological environment in which selling feels rational precisely because everyone else is doing it.
This is one reason market bottoms can be so difficult to recognize in real time. The investor rarely receives a reassuring signal announcing that the crisis is over; instead, the environment gradually shifts from panic to exhaustion while prices begin responding differently to increasingly negative information.
Apple, Amazon, and the Difference Between Price and Reality
The 2008 collapse provides numerous examples of why investors must distinguish between a falling stock price and a permanently impaired business. Apple suffered substantial volatility during the crisis, yet the company continued developing products and expanding its ecosystem, while Amazon also experienced severe price declines despite the underlying business continuing to evolve.
Amazon is particularly instructive because investors who purchased the stock during the depths of the crisis were buying into a company whose long-term potential was vastly different from the psychological perception surrounding it at the time. The Amazon example demonstrates the central principle of contrarian investing: a falling stock is not automatically a bargain, but a great business experiencing indiscriminate selling can eventually become extraordinarily mispriced.
The investor therefore has to separate price deterioration from business deterioration. If the business is permanently damaged, a falling price may simply reflect reality, but if the underlying business remains capable of producing future cash flows while fear temporarily overwhelms valuation, the decline can create an opportunity rather than simply represent danger.
Technical Analysis: Reading the Crowd Through Price
Fundamental analysis can help determine whether an asset is worth owning, while technical analysis can provide information about how market participants are behaving. Price trends, volume, moving averages, momentum indicators, support and resistance levels, and volatility can reveal whether buying or selling pressure is accelerating, weakening, or beginning to reverse.
The MACD can be particularly useful for studying momentum because it measures the relationship between moving averages and can help identify changes in directional pressure. During a major bear market, deeply negative momentum readings demonstrate that selling pressure is extreme, but they should not be interpreted as an automatic buy signal because markets can remain oversold for extended periods.
The RSI provides another way to measure the intensity of recent price movement. Extremely low readings can indicate that selling has become aggressive relative to the recent trading range, which can be useful when combined with other evidence, but an oversold market can remain oversold while the underlying trend continues downward.
The real value comes from combining these indicators with price behaviour and mass psychology. When sentiment is extremely negative, volatility is elevated, selling volume becomes intense, and technical momentum begins to stabilize or diverge from the prevailing narrative, the investor has a much stronger basis for investigating a potential reversal than simply buying because an oscillator has entered oversold territory.
Technical analysis therefore becomes a behavioural tool. The chart records what investors are actually doing, while sentiment helps explain why they are doing it.
Euphoria Comes Before the Panic
The 2008 crash cannot be understood without examining the psychology that preceded it. Before fear took control, confidence had become deeply embedded in the housing market, credit expanded aggressively, property prices appeared to validate the belief that they would continue rising, and the possibility of a major reversal was increasingly dismissed.
This is how mass psychology operates during bubbles. Rising prices attract more participants, additional participants push prices higher, and higher prices become evidence that the original thesis was correct, creating a circular feedback mechanism in which optimism produces behaviour that reinforces optimism.
Eventually, however, the marginal buyer disappears. When prices stop rising fast enough to satisfy expectations, confidence weakens, selling begins, and the same feedback loop starts operating in reverse, turning optimism into concern, concern into fear, and fear into panic.
The lesson is important because crashes do not appear from nowhere. They often emerge after prolonged periods in which investors have become conditioned to believe that rising prices are normal and declining prices are temporary, making the eventual reversal psychologically more violent than the original trend.
Strategic Buying: Turning Panic Into Opportunity
The greatest mistake during a market crash is assuming that the only choices are doing nothing or buying everything. Strategic investors have a third option: identify the securities where the psychological damage appears greater than the fundamental damage, establish a thesis, and then accumulate exposure as the evidence begins to support the opportunity.
This approach requires patience because the market does not owe investors a clean bottom. During 2008, prices continued falling after many investors believed they had already reached extreme levels, demonstrating why position sizing and staged entry are critical components of contrarian investing.
The objective is not to catch the exact bottom. The objective is to purchase assets at prices where the potential long-term reward substantially outweighs the remaining risk, while maintaining enough capital to withstand additional volatility if the market continues lower.
That distinction separates disciplined contrarian investing from reckless bottom fishing. The contrarian does not ask, “Has the market fallen enough?” He asks, “Has the market fallen enough relative to the underlying opportunity?”
Timing the Market: Follow the Trend, Not the Emotion
One of the most dangerous assumptions in investing is that anyone can consistently identify the exact day a major market decline will end. History suggests otherwise, and the 2008 experience demonstrates why trying to predict the precise turning point can result in premature positioning, excessive risk, or emotional capitulation when the market continues moving against the investor.
A better approach is to study the broader trend and look for evidence that the psychological structure is changing. A stabilization in price, improving breadth, declining selling pressure, momentum divergence, and a shift from indiscriminate liquidation toward selective buying can collectively provide more useful information than any single indicator.
This is where patience becomes a strategic advantage. An investor does not need to purchase the exact low to generate extraordinary returns, because buying substantially above the bottom can still produce enormous gains if the underlying asset has been severely mispriced.
The 2008 crash therefore teaches an important lesson about timing: you do not need perfect timing when you have disciplined positioning. The investor who waits for absolute certainty will often enter after the largest portion of the recovery has already occurred, while the investor who enters gradually as evidence improves can participate without pretending to know the future.
The Contrarian Lesson of 2008
The S&P 500 crash was devastating for investors who were heavily exposed and unprepared for the collapse, but it was also one of the clearest demonstrations of how mass psychology can manufacture opportunity. Fear did not merely reflect falling prices; it helped create additional selling, which pushed valuations lower and eventually produced conditions in which long-term expected returns became increasingly attractive.
The same principle appears across market history. Euphoria encourages investors to assume that favourable conditions will continue indefinitely, while panic encourages them to assume that unfavourable conditions will never end, and both assumptions are products of the same human tendency to extrapolate the present into the future.
The investor who understands this psychological mechanism can begin to see market crashes differently. Instead of asking only how much money has been lost, he asks which assets have been damaged fundamentally and which have simply been punished by the crowd, because those two categories can produce radically different long-term outcomes.
Conclusion: Chaos Is Not the Enemy
The 2008 S&P 500 crash remains one of the most important case studies in market psychology because it demonstrates how fear can overwhelm rational analysis and how extreme selling can create opportunities that appear almost impossible to recognize while the crisis is unfolding. The market eventually recovered, but the recovery did not reward everyone equally because investors who sold during maximum fear removed themselves from the rebound, while those who maintained discipline and selectively accumulated quality assets gained exposure to the subsequent expansion.
The lesson is not that crashes are easy to trade. They are not, and anyone claiming otherwise is ignoring the psychological and financial risks involved. The lesson is that chaos changes the opportunity set, and investors who understand mass psychology, behavioural biases, technical behaviour, valuation, and risk management can recognize opportunities that remain invisible to participants trapped inside the prevailing narrative.
Fear tells you what the crowd feels. Price tells you what the crowd is doing. Technical analysis helps reveal whether that behaviour is strengthening or weakening, while fundamental analysis helps determine whether the underlying asset deserves another look.
That combination creates the real contrarian advantage. When the crowd sees only chaos, the disciplined investor looks for the divergence between perception and reality, because that is where the next opportunity often begins.