
Nasdaq Monthly Chart Outlook
Dec 25, 2022
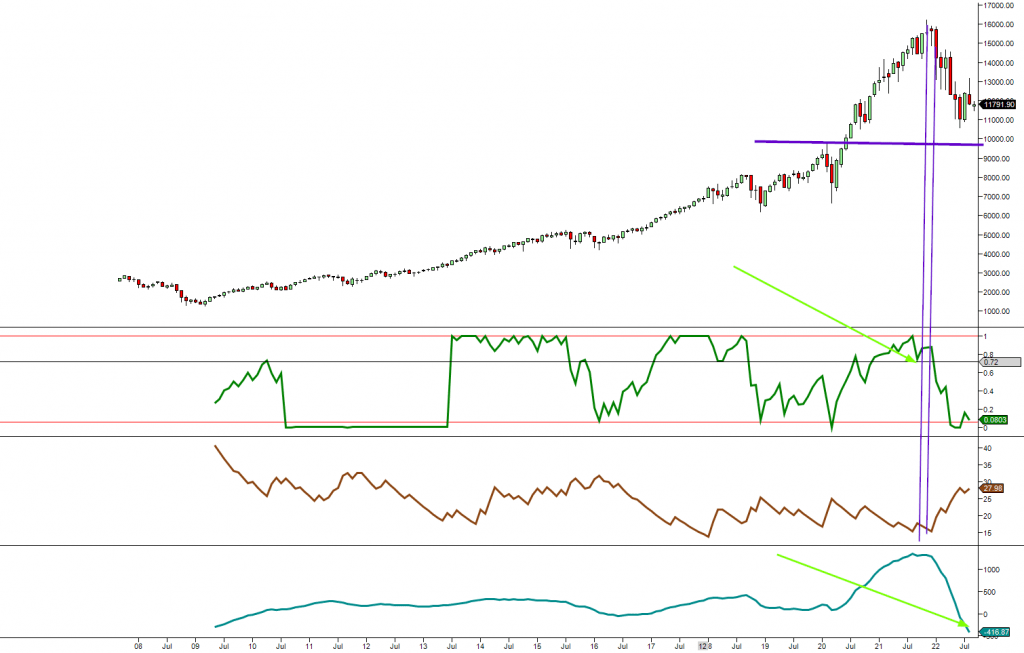
If the markets follow the projected path from October, a test of the 9,900 to 10,500 ranges will probably mark a bottom. In other words, if they follow the 1973-74 pattern, a test of the above ranges will make for an enormous opportunity (the purple support line in the 1st part of the chart). Will the Nasdaq follow this path; nothing is written in stone. However, if it were to happen, it would provide a mouth-watering opportunity for Tactical Investors. Market Update September 11, 2022
The above objectives were satisfied. It dipped to the low 10K ranges and held. Shortly after that, it reversed course and started to trend higher. In November, the Nasdaq experienced two blistering rallies, so it is now paving the way for a test of the 12,300 to 12,600 range. There is a good chance that a close at or above 12,600 will pave the way to take out its Aug highs.
Other excerpts from recent issues prove that it pays to buy the fear
While it looks like the Dow lost a lot of weight, it shed less than 700 points since the last update. On August 9, it was roughly at 32,800. Risk takers should have opened up longs. Market Update August 27, 2022
Short term, the markets are entering a corrective phase; the SPX has hit short-term targets. Former support points turned into resistance which should turn into zones of support again, albeit on a short-term basis. The likely pullback targets fall in the 3960 to 4020 with a decent chance of overshooting as low as 3870. Market Update August 2, 2022
It traded as low as 3,886, so it traded below the low end of the official suggested range by roughly 70 points. The markets should continue rallying as the selling pressure is easing, bearish readings are high, the masses are unsure, and the dollar is close to putting in a short-term top. Market Update September 11, 2022
Risk takers should continue holding until the Dow tests the 33,600 to 34K ranges and the Nasdaq trades to 13,500. At that point, all the higher-risk positions opened should be closed. You can also modify this trade in line with your trading style. Market Update September 11, 2022
FAQ
Q: What is the projected path for the markets from October?
A: The projected path suggests a potential test of the 9,900 to 10,500 ranges, marking a bottom if following the 1973-74 pattern.
Q: Will the Nasdaq follow this path?
A: There is no certainty, as nothing is written in stone. However, if it were to happen, it could present an opportunity for Tactical Investors.
Q: What were the recent objectives and outcomes?
A: The markets dipped to the low 10K ranges, held, and then reversed course. In November, the Nasdaq experienced two strong rallies, paving the way for a potential test of the 12,300 to 12,600 range.
Q: What does recent data suggest about market behaviour?
A: Recent data indicates that buying during fear has proven beneficial. Despite the appearance of a significant drop, the Dow only shed less than 700 points since the last update.
Q: What is the short-term outlook for the markets?
A: The markets are entering a corrective phase, with the SPX hitting short-term targets. Former support points have turned into resistance, which may become support zones again on a short-term basis. The likely pullback targets range from 3960 to 4020, with a possibility of dipping as low as 3870.
Q: What was the market reaction in September?
A: The market traded as low as 3,886, falling below the suggested range by approximately 70 points. However, a continued rally is expected with easing selling pressure, high bearish readings, uncertain sentiment, and the dollar nearing a short-term top.
Q: What is the recommended approach for risk-takers?
A: Risk takers should continue holding positions until the Dow tests the 33,600 to 34K ranges and the Nasdaq reaches 13,500. At that point, it is advisable to close higher-risk positions or adjust the trade based on individual trading styles.
Other Articles of Interest

Embracing Challenges, Seizing Opportunities: Investing in China

Euro ETFs: Navigating the Investment Landscape

Short Dollar ETF: Navigating the Financial Markets
Why Is Freedom of Speech Important? Embracing It as Our Birthright

BBC Global 30 Index: Forecasting Profit or Peril

Enhancing AI Dangers Awareness: Understanding the Risks

Digital Currency Group: Leading the Way in Cryptocurrency Innovation

Denmark Anti-immigrant Ads: U.S. helpless against Russian hardware

Artificial Intelligence Investing is transforming investment strategies

The Patient Investor: Unveiling the Realm of the Strategist

Ishares robotics and artificial intelligence etf: A Financial Odyssey

Inflation Tax: Stealthy Threat to Middle-Class America

Mastering The Boom and Bust cycle: Buy High, Sell Smart

Unveiling Banking Scams: Deceitful Schemes Targeting the Masses

BIIB Stock Price Analysis: To Bet or to Fold the Cards
Musk Feuds With Coal Company Exec who call him out

AIIB: Paving the Future of Asian Infrastructure!
