Investor Sentiment Survey Defies Stock Market Crash Outlook

Investor Sentiment Survey Defies Stock Market Crash Outlook


Investor Sentiment Survey: Market Dynamics in Flux

Updated August 2023

In August 2023, we stand at the threshold of a captivating expedition through time. Our voyage will commence in the present, and as we delve into history, we’ll unveil the profound significance of investor sentiment surveys as indispensable instruments for informed decision-making. We will distinguish historical comments from current ones by including relevant dates to enhance clarity and understanding. This approach will offer a comprehensive perspective on our insights and potential future trajectories. Join us as we embark on this fascinating journey through the annals of investor sentiment.

The sentiment indicators have returned to their average levels. While they are not the exclusive constituents of Mass Psychology, their integration into several of our tools underscores their pivotal role. Essentially, this signifies that Mass Psychology is poised to take the lead. The prominent actors have effectively persuaded many technical analysts and the general public to abandon caution and ardently pursue the next significant trend, regardless of the cost. Consequently, technical analysis and fundamental metrics will not yield the same effectiveness as in the past 12-16 months.

Anticipations point toward the markets entering a phase of dissonance or, in simpler terms, chaotic trading. It’s an apt moment to recall that when a rally, akin to the one observed in the Nasdaq and AI stocks, reaches its zenith, it is typically followed by a substantial decline. Hence, exercising caution is advisable. Nevertheless, there is a notable exception in this scenario. Given the unique nature of this concentrated rally, only the overheated sectors and indices are expected to bear significant impacts. Sectors outside the high-tech domain and indices, such as the Russell 2000, SP400, and, to a lesser extent, the Dow Jones, may undergo milder declines.

Investor Sentiment Survey: Drawing Parallels with Past Events

Updated July 2023

In the fast-paced world of stock markets, history seems to repeat itself, yet we fail to heed the warning signs. The dot-com bubble, the housing bubble, and the patterns observed in 1973-1974 all share eerie similarities with the present situation. However, the prevailing belief is that this time is different, as we heard during the housing crash. Past markets peaked in 2007, experiencing a strong rebound in 2008 that deceived many, much like the current scenario. The subsequent drop in 2009 shocked those who had entered during the rally, causing them to stay away from the market for years.

Present Market Realities: A Mirror Image of the Past

Today, the number of individuals investing in the market is rapidly approaching the levels seen in 2008, with over 61% actively participating. Astonishingly, even a significant portion of individuals over 85 are nearly fully invested. The bullish readings have now hit the 50 mark, marking five consecutive weeks of surpassing the historical average of 38.5 after trading below this threshold for 18 months.

A Lesson from Scarcity: The Mindset of Today’s Investors

Let’s explore a real-life illustration of the collective mentality at play. The scarcity of sriracha hot chilli sauce has led to soaring prices, with some bottles reaching over $70 on the secondary market. The high demand for this popular sauce, lasting for more than a year, has enabled resellers to take advantage of the situation, selling bottles at even higher prices on platforms like Amazon and eBay. This scarcity-driven mindset misclassifies desires as needs, and price becomes irrelevant until financial resources are depleted.

Mindset in the Markets: The AI Feeding Frenzy

Drawing a parallel to the markets, a belief in the revolutionary potential of AI has led people to invest fervently, disregarding prices and expecting indefinite growth. This is reminiscent of historical bubbles, such as the infamous tulip mania. The “it’s different now” theory takes root, leading to euphoria and joy and paving the way for intense fear and panic when the tides turn.

Preparing for the Future: Reduce Risk in the AI Sector

While history may not repeat itself exactly, it often comes dangerously close. A plausible scenario is that the AI sector might experience a severe decline while cyclical stocks and critical commodities find higher lows during the next pullback. A proactive reduction of long positions in AI-driven stocks may be advisable for low to medium-risk investors.

Beware the Shift: Bearish Readings on the Horizon

As Bullish levels rise, the possibility of reaching 55 becomes apparent, hinting at a potential surge in Bearish readings when the outlook shifts. When Bearish readings start climbing, it will be time for investors to take decisive action. Understanding investor sentiment surveys and learning from historical patterns can be crucial in navigating the market’s treacherous waters.


Unveiling the Stock Market Prospects

March 7, 2023

Navigating through periods of capitulation and despondency, akin to the 2008-2009 financial crisis, requires patience and discipline. The market’s decline back then caught many investors off guard, as they prematurely believed it had bottomed out in mid-2008, only to witness further plummeting until March 2009, when pessimism peaked. This cautionary tale serves as a reminder of the importance of patience and discipline when investing, as they complement each other in achieving success.

While our latest update didn’t provide specific targets for the SPX, let’s focus on the NDX, an extension of the Nasdaq. The NDX (Nasdaq 100) has the potential to test the range of 13,600 to 13,800, possibly surpassing to reach 14,160. However, the NDX must maintain a daily close above 11,960 to validate this outlook. If the NDX accomplishes this, it is likely that other indices will follow suit, resulting in a rally lasting two to three weeks, with a potential extension of up to four weeks.


2020 Stock Market Crash Outlook

Vast amounts of liquidity are already being added to this market, but you have seen nothing yet. Helicopter money is about to become a reality, and regardless of the mantra, it’s different this time; nobody can fight a fed that is determined to unleash the mother of bailout packages.

It appears that markets are experiencing the “backbreaking correction” one which every bull market experiences at least once and is often mistaken for the end of the bull.  In today’s manipulated markets, one cannot tell which correction will morph into a backbreaking correction, as free-market forces have almost been eliminated from today’s markets.  While it feels like the end of the world, such corrections always end with a massive reversal.  Given the current overreaction to the coronavirus, there is now a 70% probability that when the Dow bottoms and reverses course, it could tack on 2200 to 3600 points within ten days. Interim update March 9, 2020

Exciting readEconomy: Exploring Different Economic Systems

A Once-in-a-Lifetime Buying Opportunity

Based on our indicators, the markets were expected to release some steam. Still, mass hysteria turned a normal correction into a bloodbath in the short-term timelines and a generational buying opportunity when viewed from a long-term perspective.

Typically, the markets would pull back sharply and then tread water until our indicators moved into the highly oversold ranges. If the sentiment is still trading in the maddens zone when our technical indicators hit the highly oversold ranges, there is a 90% chance it will trigger the father of all buy signals.

There is one massive indicator validating the outlook that this current makes for a great opportunity. It’s insider activity, and the readings on this indicator are off the charts.

Insiders’ Strong Buy Activity: A Bullish Signal for Investors

Insiders are taking advantage of the significant market pullback by purchasing shares, and the sell-to-buy ratio is used to measure the intensity of their buying. Typically, a reading of 2.00 is considered normal, while a reading below 0.90 is considered exceptionally bullish. The sell-to-buy ratio is at a staggering 0.35, indicating that insiders are aggressively buying shares.

The latest readings indicate that Vickers’ benchmark NYSE/ASE One-Week Sell/Buy Ratio is 0.33, while the Total one-week reading is 0.35. These numbers demonstrate that insiders are not only purchasing shares but doing so with great enthusiasm. Similar buying patterns were observed in late December 2018 after the stock market crash on Christmas Eve, as well as in early 2016 during a market correction and in late 2008/early 2009 during the depths of the Great Recession. These periods were considered exceptional opportunities to invest in stocks. Insiders seem to be suggesting that the current situation presents a similar opportunity. https://yhoo.it/2TV0cE2


 The Ever-Repeating Story of Market Bubbles and the Power of Contrarian Thinking

Learn the essential lesson every new subscriber must grasp as we explore mass psychology in the stock market. In a world where following the crowd often leads to bitter outcomes, we uncover the dangers of blindly following popular sentiment and the rewards of embracing significant pullbacks.

Navigate the challenging waters of market volatility, especially during the turbulent September to October period, when the crowd’s reactions to news can be disastrous. Discover the truth behind every catastrophe-turned-disaster, where false narratives mislead the masses. If disasters were profitable, wouldn’t the Dow be closer to zero than breaching 36K?

Embrace a fresh perspective and empower yourself to go against the crowd. Explore the stock market as a gauge for disaster-prone situations, unveiling the secrets to successful investing amidst the ever-changing tides of market sentiment.

October 2019 Stock Market Snapshot: Unveiling Trends and Insights

Once again, we witness in real-time the wisdom of buying stocks when the masses are gripped by panic. It is during these moments that astute investors discover genuine bargains. Patience is crucial in waiting for these opportunities and, more importantly, taking action when they arise. A similar situation unfolded during the period from October 2018 to January 2019. However, as is often the case, most investors will succumb to panic and flee despite eagerly seeking a chance to invest in the stocks they were abandoning just under two weeks ago.


Investor Sentiment Survey Challenges Market Crash Predictions

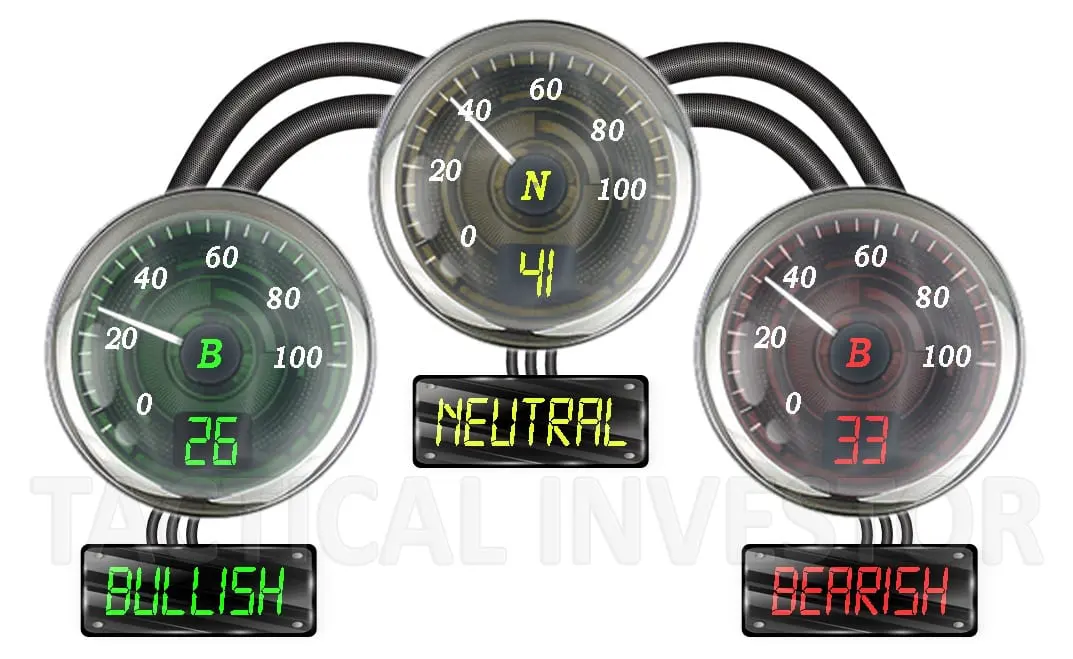
While the action has been restricted to the upside, the same cannot be said for sentiment readings. The moves have been wild for the past four weeks, and this trend appears to be gaining traction.  The number of bulls this week surged to 47%, and the number of neutrals and Bears experienced a sharp drop. Additionally, there was a sharp move in our anxiety gauge. Market Update Nov 2, 2017

Despite the tall tales often told by experts like Marc Faber regarding the impending stock market crash, there is no substantial evidence to support such baseless assertions. One of the most crucial factors indicating the longevity of a market is investor sentiment. As the crowd is far from euphoric, it suggests that a market crash is unlikely to occur. However, a correction is possible due to the markets being significantly overbought.

Therefore, if the markets experience a temporary pullback, it is important not to panic but instead consider such sharp declines as positive developments. These pullbacks allow the markets to release built-up pressure and regain a more sustainable trajectory.

Investor Sentiment Not Supportive of a Stock Market Crash

The market has not let out a decent dose of steam for some time, but when a market is trading in the overbought ranges, it is generally prudent to wait for the market to let out a decent dose of steam before opening long positions in the major indices. The other option is to establish positions in stocks that are trading in the oversold to extremely oversold rangesMarket Update Nov 2, 2017

That is what we told our subscribers back in November, and those views still hold. While the markets are overbought, investor sentiment trades in the oversold ranges.  Most Investors have not embraced this bull market; until they do, it will not crash. Therefore, all strong pullbacks should be viewed through a bullish lens.

Compile a list of stocks you would love to own at a discount. When the market’s pullback jump in and buy them.  Alternatively, you can look for strong stocks that have pulled back and deploy 50% of your capital into them.

Investor Sentiment Analysis

Investor sentiment has a long way to travel before it hits the Euphoric zone, so don’t listen to the naysayers who love creating a mountain out of a molehill. These charlatans delight in convincing the masses that the markets are ready to crash the moment they start to let out a bit of steam.

As the markets are extremely overbought, investors should not be surprised if they let out some steam. At this point, it would be better if they shed a hefty steam dose.  If this scenario comes to pass, use it to open up positions in solid companies.

A Broken Record: Repeating Assertions Without Evidence

Perhaps one day, he will make an accurate prediction; hopefully, his followers won’t be financially devastated by then.


FAQ on Investor Sentiment Survey Article

Q: What is the Investor Sentiment Survey about?
A: The Investor Sentiment Survey analyzes the sentiment and behaviour of investors in the stock market.

Q: What has been the recent trend in sentiment readings?
A: The recent trend in sentiment readings has shown significant volatility and wild movements over the past four weeks.

Q: How did the number of bulls and neutrals/bears change in the recent survey?
A: The number of bulls surged to 47% in the recent survey, while the number of neutrals and bears experienced a sharp drop.

Q: What does the anxiety gauge indicate?
A: The anxiety gauge registered a sharp move, reflecting heightened market anxiety.

Q: What role does investor sentiment play in the market’s longevity?
A: Investor sentiment is considered one of the crucial factors indicating the longevity of a market. Currently, as the crowd is far from euphoric, it suggests that a market crash is unlikely to occur.

Q: What is the likelihood of a market correction?
A: A correction is possible due to the markets being significantly overbought.

Q: How should investors react to temporary pullbacks in the market?
A: Rather than panicking, sharp declines should be viewed as positive developments, allowing the markets to release built-up pressure and regain a more sustainable trajectory.

Q: How does investor sentiment impact market crashes?

A: As long as investor sentiment remains far from euphoric, a market crash is unlikely. Investors must embrace strong pullbacks and maintain a bullish perspective until sentiment reaches the zone of euphoria.

Q: What should investors do during a market pullback?
A: During a market pullback, investors should compile a list of stocks they would love to own at a discount and consider buying them. Alternatively, they can look for strong stocks that have pulled back and allocated 50% of their capital into them.

Q: What does the conclusion suggest about market predictions?
A: The conclusion emphasizes that baseless predictions of a market crash should not sway investors and instead focus on the long-term perspective. It advises against following the naysayers who create unnecessary panic.

Q: How does insider activity indicate a bullish signal?
A: Insiders have been actively purchasing shares, and the low sell-to-buy ratio indicates their bullish solid sentiment. This behaviour is similar to previous periods when insiders bought shares during market downturns, resulting in remarkable buying opportunities.

Q: What are the current readings of the benchmark NYSE/ASE One-Week Sell/Buy Ratio?
A: The current readings for the NYSE/ASE One-Week Sell/Buy Ratio are 0.33.

Q: How have insiders behaved during previous market corrections?
A: Insiders exhibited similar behaviour during the market correction in late December 2018, early 2016, and late 2008/early 2009. These periods presented great buying opportunities.

Q: What can be expected from the NDX (Nasdaq 100) regarding its range and potential rally?

A: The NDX can test the range of 13,600 to 13,800, possibly reaching 14,160. A daily close above 11,960 is crucial to validate this outlook. If achieved, it will likely trigger a rally lasting two to three weeks, with a potential extension of up to four weeks.

Q: What does the cautionary tale from the 2008-2009 financial crisis teach us?
A: The cautionary tale highlights the importance of patience and discipline when investing, as prematurely assuming the market bottom can result in further decline and missed opportunities.

Q: What is the significance of possessing both patience and discipline?

A: Possessing both patience and discipline is crucial for successful investing. Patience allows investors to wait for the right opportunities and avoid making impulsive decisions based on short-term fluctuations. Discipline ensures investors stick to their investment strategies and avoid making emotional or irrational choices.

Q: How do market reactions to disasters and panic affect investor behaviour?
A: Market reactions to disasters often lead to overreactions by the crowd, causing panic selling or buying. However, history has shown that following the masses during such times rarely leads to profitable outcomes. Investors should be cautious of false narratives and avoid following the herd unless they seek a quick end to their investments.

Q: What does the stock market’s behaviour during past bubbles indicate?
A: The stock market’s behaviour during past bubbles follows a similar pattern. Mass psychology plays a significant role; following the masses without careful analysis can result in poor outcomes. Recognizing this pattern is essential for new investors to understand the dynamics of mass psychology in action.

Q: How does the current liquidity situation in the market impact investment opportunities?

A: The current market is experiencing significant liquidity injections, and the possibility of helicopter money becoming a reality adds to the market dynamics. These factors can create favourable conditions for investment opportunities, and astute investors can identify genuine bargains during market turmoil.

Q: What is the expectation regarding the market’s backbreaking correction?
A: The current market correction, often mistaken for the end of a bull market, is called the “backbreaking correction.” While it may feel like the world’s end during such periods, historical data shows that these corrections often end with a massive reversal. Considering the overreaction to external factors like the coronavirus, there is a 70% probability that a significant rebound could occur once the Dow bottoms out.

Q: How does insider activity provide a bullish signal for investors?

A: Insiders’ vigorous buying activity, reflected in the low sell-to-buy ratio, indicates their confidence in the market. Previous instances of insider buying during market downturns have resulted in exceptional buying opportunities, making their current behaviour a positive signal for investors.

Q: What is the main takeaway regarding market predictions and investor sentiment?
A: The main takeaway is approaching market predictions cautiously and focusing on investor sentiment. If investor sentiment remains far from euphoria and insiders continue to show bullish behaviour, strong pullbacks should be embraced as potential buying opportunities. Patience, discipline, and a long-term perspective are vital to navigating market fluctuations and achieving investment success.

Q: What lessons can be learned from past market experiences and investor behaviour?
A: Past market experiences highlight the importance of patience, discipline, and avoiding succumbing to panic. Investors who maintain a rational approach and take advantage of opportunities during market pullbacks tend to fare better in the long run. The tendency for investors to abandon stocks during panic-driven periods often results in missed investment opportunities.

Enrich Your Knowledge: Articles Worth Checking Out

which of the following is the biggest pitfall of economic indicators

Which of the Following Is the Biggest Pitfall of Economic Indicators: Analysis

Feb 29, 2024 Which of the following is the biggest pitfall of economic indicators? Before diving into the core of ...
Smart Investing Unveiled: Perception Manipulation and Sentiment Indicator

Perception Manipulation: Mastering the Market with Strategic Insight

s Perception Manipulation & Investing: Sentiment Indicators Unveiled Updated Feb 24, 2024 By the ripe age of 18, the average ...
The Contrarian Outlook - Unleashing Success

Contrarian Outlook: A Pathway to Breakthrough or Breakdown

Contrarian Outlook: Balancing the Scale of Success and Risk Updated Feb 24, 20234 Introduction Adopting a Contrarian Outlook could be ...
Market Uncertainty: the emotion that separates traders from speculators

Market Uncertainty: A Challenge for Investors

Feb 22, 2024 Discerning the Hazards of Market Uncertainty with Poise Uncertainty, a state of being unsure or not knowing, ...
Stock market basics for beginners: do or die

Stock market basics for beginners: Adapt or Die

Stock market basics for beginners Updated Feb 22, 2024 A Contrarian Investor does not follow the Herd Sol Palha  Investing ...
Why Covered Calls are a Bad Strategy

The Unfortunate Truth: Why Covered Calls are a Bad Strategy

Feb 21, 2024 INTRODUCTION Covered calls have emerged as a favoured choice among the myriad methods, glittering with the illusion ...
DJU Index: To buy or not to

DJU Index: To Buy or Flee? Unraveling the Market Mystery

DJU Index: Decoding Signals – Is it Flashing Bullish or Bearish in the Market? Feb 21, 2024 Introduction: Intriguing Developments ...
Stock Market Psychology 101: Learn, Thrive, and Profit

Stock Market Psychology 101: Learn, Thrive, and Profit

Feb 20, 2024 Understanding Stock Market Psychology Through Charts for Beginners Understanding the stock market is akin to deciphering an ...
In 1929 the Stock Market Crashed Because of Greed, stupidity and arrogance

In 1929 the Stock Market Crashed Because of Greed

In 1929, the Stock Market Crashed Because of unchecked speculation Feb 20, 2024 Introduction to the 1929 Stock Market Crash ...
Palladium Forecast: Discovering the Hidden Bull Market Trend

Palladium Forecast: Unveiling the Stealth Bull Market

Palladium Forecast: Navigating the Silent Bull Market Unfolding Updated Feb 19, 2024 The lustrous white metal Palladium is silently scripting ...
The Journey to Remove Brainwashing

Unshackling Minds: The Journey to Remove Brainwashing

Feb 16, 2024 Unshackled Minds: The Journey to Remove Brainwashing Introduction: The Tangled Threads of Thought Manipulation In the grand ...
Mastering the Trading Range

Mastering the Trading Range: Unlocking the Potential for Explosive Gains

The Trading Range:  Masterfully Navigating Volatility  Feb 14, 2024  Introduction In the ever-fluctuating world of stock markets, mastering the trading ...
Unveiling the VIX Fear Indicator: Best time to buy is when the crowd is scared

Unveiling the VIX Fear Indicator: A Case Study in Market Volatility

Harnessing the Power of the VIX Fear Indicator: A 2016 Case Study Updated Feb 12, 2024 The VIX fear indicator, ...
Mind Games: Unmasking Brainwashing Techniques in Institutions & Media

Mind Games: Unmasking Brainwashing Techniques in Institutions & Media

Unmasking the Invisible: The Subtle Art of Brainwashing in Institutions & Media Updated Feb 11, 2024   Introduction: Intriguing Insights ...
The Gamblers Mindset: Exploring the Hidden Desire for Defeat

The Gamblers Mindset: The Enigmatic Urge to Embrace Loss

The Gamblers Mindset: Exploring the Secret Desire to Lose Syndrome Updated Feb 11, 2024 Introduction: The Investor's Paradox: Unraveling the ...