


Beyond the Herd: Mastering Stock Market Indicators for Success
Updated Jan 24, 2024
It takes no effort to lose control and flee for the hills: the reward is a hard kick to the stomach and massive losses. For such individuals, always sell at the bottom and buy at the top. Until they understand that the crowd’s only purpose is to signal what one should not do, these investors will forever end up on the wrong side of the market.
The astute individual who does not panic walks away with a huge reward, which is how it’s been for millennia, and nothing will change for another 1000 years. This gauge provides a clear, in-depth view of what the masses think and allows us to determine when to get in or out of the markets. We are not trying to identify topping or bottoming action.
Stock Market Indicator 3: Anxiety Index
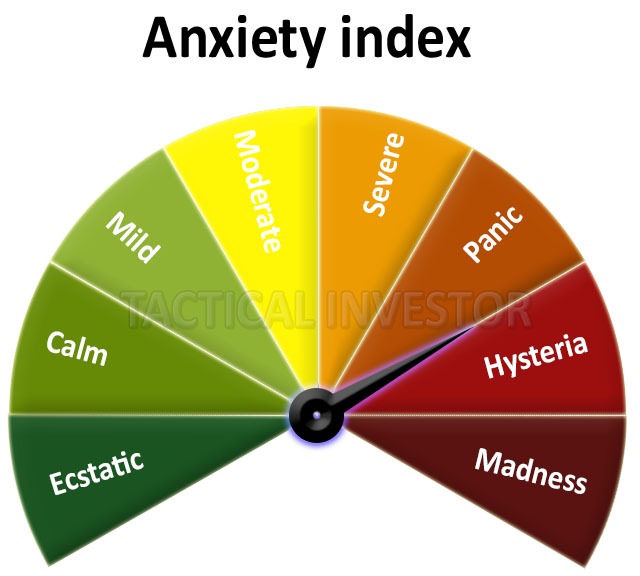
The needle on the anxiety sensitivity index provides a highly effective method for gauging extreme euphoria or mass stress/fear in the market. It is ideal for the readings to fall within the extreme range on either spectrum. By combining this data with our sentiment indicators, which include the bears, the bulls, and the neutral individuals, we can identify significant turning points in the market.
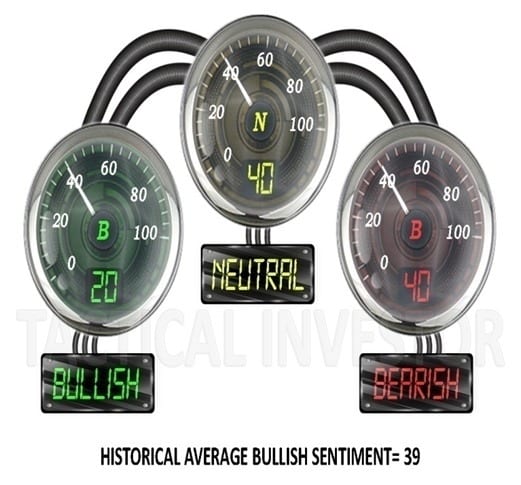
Market trends often undergo significant shifts when bullish sentiment trades within the 50-55 range, with higher readings holding greater significance. High bullish readings are typically associated with market tops, while bearish extremes indicate potential market-bottoming action. A reading of 50-55 shows a state of total panic among the crowd, signalling a possible buying opportunity from a long-term perspective.
A particularly notable occurrence is when neutral readings surge into the 50-55 range, with higher readings carrying more weight. This surge indicates extreme uncertainty, as bears and bulls are unsure about their next moves, causing them to avoid the markets. It reflects a form of learned helplessness that was observed from 2009 until almost 2018, when the stress and shock of the housing collapse left many investors paralyzed by fear, leading them to stay away from the markets for extended periods.
The Power of Mass Psychology in Enhancing Indicator Effectiveness
Incorporating mass psychology with these indicators enhances their effectiveness. Mass psychology helps understand the crowd behaviour of investors and how it influences market dynamics. Investors can gain deeper insights and make more informed decisions by considering psychological factors like fear, greed, and sentiment alongside these indicators. Mob psychology adds a valuable layer of understanding to the market analysis process, improving the efficacy of these indicators in predicting market movements.
The masses are notorious for panicking at precisely the wrong time and turning euphoric when they should be fleeing for the hills. When the trend is up, and the masses are uncertain or in panic mode, sharp pullbacks should be viewed as manna from heaven.

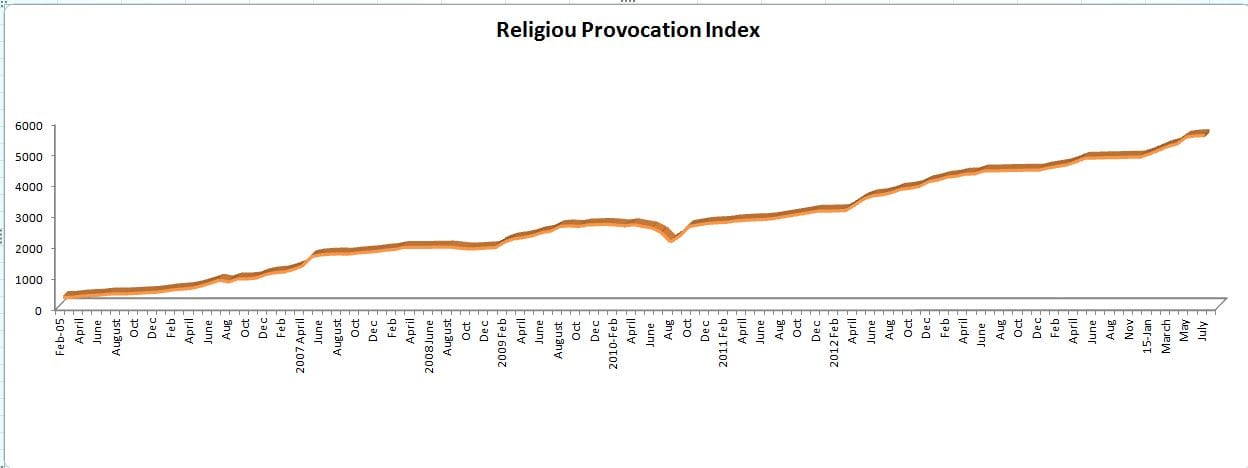
Stock Market Indicator 2: Religious Provocation Index
We have been maintaining proprietary indices since 2004. These tactical Investor Indices are unique and only displayed on the Tactical Investor site. To our knowledge, no other service or site maintains such indices.
For example, the Religious provocation index accurately predicted that the Iraq war would be a failure and far from being over when then-President Bush openly stated to the world that the Iraq war was over. Instead, we noted that it had only just begun. It predicted that the Afghan war would be a failure, and failure it was. It indicated that tensions would rise to the boiling point, and in 2006, Israel attacked Hezbollah. Then we had the Arab Spring. And the list goes on. We will be adding the other indices to this page shortly. Please note there is always a delay between what we publish and what we send to our paying subscribers.
The V indicator
This indicator provides data in terms of market action; higher readings indicate that the markets will experience more volatility and vice versa. When the trend is up, more significant moves are experienced in that direction. If it turns neutral, one can expect a sharp pullback, which should be viewed as a buying opportunity.
Volatility is a Trend player’s best friend; in this case, it’s up so astute players can use strong pullbacks to add to current positions or open new positions.
A Tactical Investor refuses to panic even when no reprieve is in sight, for history indicates that panicking never pays off in the markets. The masses were and will always be prime cannon fodder candidates; they are hard-wired to panic, and when they do, the outcome is never good. Examine any panic-based event; one thing stands out like a sore thumb: the masses always took a beating.
Unveiling the Path to Stock Market Success: Unlocking the Winning Strategy
1. Grasp the Power of Mass Psychology: Gain an advantage by comprehending the collective sentiment that drives market behaviour. Harness the insights into how the majority thinks.
2. Embrace Contrarian Investing: Embrace a distinct perspective and seize opportunities that others shy away from. Learn to identify undervalued assets poised for potential growth.
3. Anticipate Emerging Trends: Stay ahead of the curve by identifying sectors on the brink of breakthroughs. Recognize emerging trends before they become mainstream.
4. Pinpoint Promising Stocks: Discover the methodology for identifying robust stocks within these promising sectors. Uncover the criteria that distinguish the winners from the rest.
5. Master the Fundamentals of Technical Analysis (TA): Enhance your decision-making process with technical indicators. Fine-tune your entry and exit points using the powerful tool of TA.
Remember, while no magical formula guarantees success, integrating and applying these strategies significantly increases your chances of achieving remarkable results.

The Power of Mass Psychology in Investing
Understanding the power of mass psychology can be a game-changer in investing. Mass psychology refers to the influence that the attitudes and behaviours of the masses have on individual decision-making processes. By recognizing and leveraging this phenomenon, investors can gain valuable insights into market trends and make profitable investment decisions.
Two renowned traders who exemplified the understanding of mass psychology were Jesse Livermore and Bernard Baruch:
Jesse Livermore: Known for his contrarian approach, Livermore famously stated, “The market is never wrong; opinions often are.” He recognized that going against the crowd when sentiment reached extremes could lead to profitable opportunities. Livermore capitalized on the irrational behaviour of the masses by buying when others were selling in panic and selling when others were caught up in the euphoria.
Bernard Baruch: A successful speculator and advisor, Baruch emphasized the significance of mass psychology in his investment philosophy. He believed that understanding and capitalizing on the emotional swings of the market was crucial to success. Baruch was known for his ability to read market sentiment and make strategic investment decisions based on the prevailing psychology of the masses.
Market Sentiment and Opportunities
One key aspect of mass psychology is the concept of market sentiment. Market sentiment refers to investors’ overall mood or attitude towards the market, which can swing between extreme fear and optimism, often driving stock prices to undervalued or overvalued levels.
During mass panic and fear, investors tend to sell off stocks in a rush, causing prices to plummet. This presents a golden opportunity for savvy investors who recognize that the market is overreacting. By keeping a cool head and analyzing a company’s underlying fundamentals, they can identify undervalued stocks with strong potential for future growth.
Conversely, mass euphoria can also lead to overvalued stocks. Prices can skyrocket to unsustainable levels when the market is flooded with optimism, and investors are caught up in a buying frenzy. This is where understanding mass psychology becomes essential. Experienced investors know that this state of euphoria is often short-lived. They take advantage of the overvaluation by selling their stocks, locking in profits before the market corrects itself.
While mass psychology can provide valuable insights, it should not be the sole factor driving investment decisions. Fundamental analysis, risk management, and diversification are crucial to a successful investment strategy. By combining an understanding of mass psychology with sound investment principles, investors can confidently navigate the market and increase their chances of achieving profitable returns.

Originally published on August 3, 2015, this piece has undergone continuous updates, with the most recent update completed in Jan 2024
Articles Topics of Interest:


References
Esoteric Cycles
The Trend is Your Friend
Group Think Psychology
The Fear and Greed Index
Mass Psychology
