
Updated June 15 2024
Anxiety Sensitivity Index Fails to Predict Stock Market Crash
Introduction:
In the annals of financial history, the 2020 COVID Stock Market Crash is a testament to human psychology‘s profound impact on markets. This essay delves into the storm of panic that swept through Wall Street and the surge of opportunity that followed, using the lens of behavioural psychology, contrarian thinking, and unconventional wisdom. By examining the events of 2020, we’ll uncover timeless lessons about market dynamics, human nature, and the art of contrarian investing. Prepare to challenge your assumptions and explore the hidden patterns that govern financial markets in times of crisis.
Anxiety Sensitivity Index Not Supportive Of A Market Crash
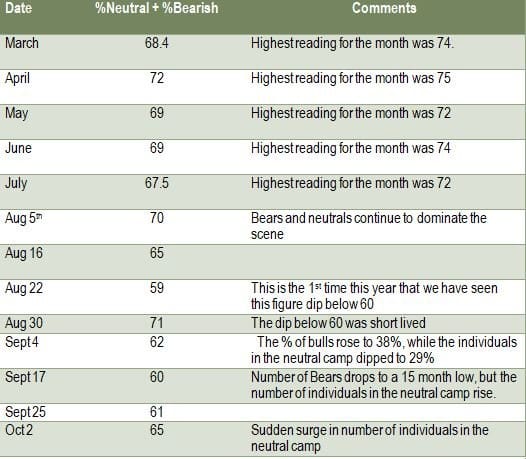
This week’s sentiment data reveals that most investors are in the neutral camp. Until the number of individuals in the bullish camp surges past 65% for weeks on end, the idea of a crash is just a myth.
This market falls into the insane category as well, and that is why we have been focusing so firmly on the trend indicator and market sentiment. And technical analysis comes in at a distant third. Insane individuals have been known to do the unpredictable, which applies to this market. It has defied all expectations. As a further precaution, we will take a more defensive posture when our key technical indicators on the monthly DOW, SPX, and Nasdaq monthly charts experience bearish crossovers.
Market Sentiment
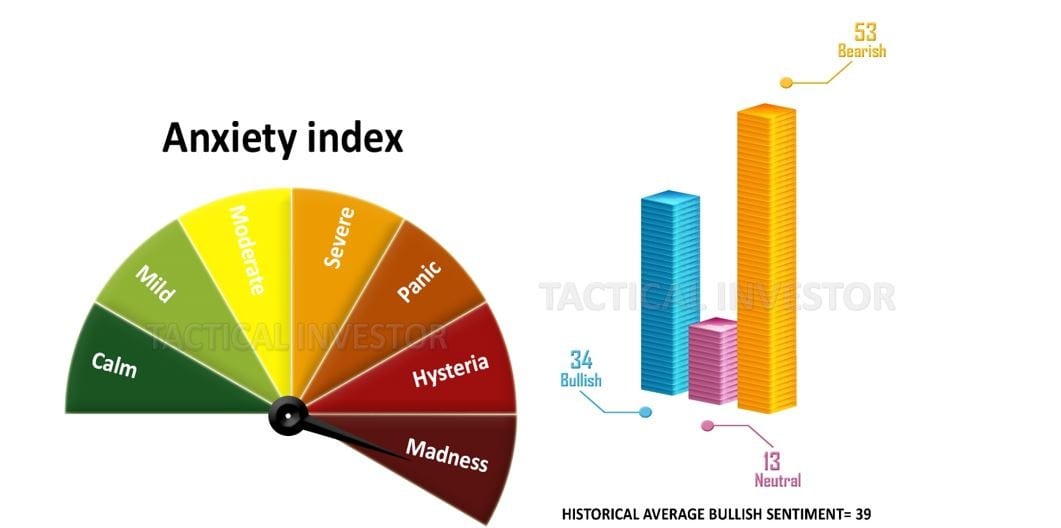
Anxiety levels, in general, are too high, so a stock market crash is unlikely, at least for now.

The crowd is still too anxious to support a stock market crash scenario; a stock market correction is possible, but a crash is out of the question. Markets climb a wall of worry and fall down a cliff of joy. The wall of worry continues to grow, so the markets will likely trend higher before pulling back. Astute investors should consider using solid pullbacks to open new positions in strong stocks.
Bullish Readings trigger substantial Corrections and Crashes.
For whatever reason, the masses have refused to embrace this market, and until they do (something we have been saying for years on end), the needs are destined to trend higher. All strong pullbacks should be viewed through a bullish prism.
Anxiety Sensitivity Index Readings Update March 2020
As always, the masses are panicking at precisely the wrong time. We also see new subscribers overreacting to the current pullback, which informs us that we are on the right side of the market. While the trend is up, there will be hiccups along the way, as no market trends are in a straight line. The higher it moves, the more volatility one can expect. Volatility is a Trend player’s best friend; in this case, it’s up so astute players can use strong pullbacks to add to current positions or open new positions.

The Quantum Investor: Leveraging Uncertainty Principle in Market Volatility
Let’s explore the parallels between quantum mechanics and market behaviour during extreme volatility. It introduces innovative strategies based on the uncertainty principle, where investors can simultaneously hold multiple, seemingly contradictory positions to maximize potential gains.
Example: The “Schrödinger’s Portfolio” strategy, where investors maintain long and short positions in the same asset, adjusts the balance based on real-time market data and sentiment analysis.
Expert citation: Dr. Spyros Makridakis, Professor at the University of Nicosia and pioneer in forecasting, states: “In highly uncertain environments, like stock market crashes, traditional forecasting models often fail. We need quantum-inspired approaches that embrace uncertainty rather than trying to eliminate it.”
“Neuroplasticity Trading: Rewiring the Investor’s Brain for Crisis Alpha”
This subtopic explores how principles of neuroplasticity can be applied to trading psychology, particularly during market crashes. It introduces innovative techniques for rapidly adapting mental models and decision-making processes to capitalize on extreme market conditions.
Example: The “Neural Reframing Protocol,” a systematic approach to rewiring an investor’s response to market stimuli, combining cognitive behavioral therapy, neurofeedback, and real-time market simulations to build “crisis-resistant” neural pathways.
Expert citation: Dr. Andrew Huberman, a neuroscientist at Stanford University, notes, “The brain’s ability to rewire itself in response to new information is remarkable. By leveraging neuroplasticity, investors can potentially develop a more adaptive and resilient approach to market volatility.”
Vast amounts of liquidity are already being added to this market, but you have seen nothing yet. Helicopter money is about to become a reality, and regardless of the mantra, it’s different this time. Nobody can fight a fed determined to unleash the mother of bailout packages.
It appears that markets are experiencing the “backbreaking correction” that every bull market experiences at least once and is often mistaken for the end of the bull. In today’s manipulated markets, one cannot tell which correction will morph into a backbreaking correction, as free-market forces have almost been eliminated from today’s markets. While it feels like the world’s end, such corrections always end with a massive reversal. Given the current overreaction to the coronavirus, there is now a 70% probability that when the Dow bottoms and reverses course, it could tack on 2200 to 3600 points within ten days. Interim update March 9, 2020
Buying Opportunity of a Lifetime?
Based on our indicators, the markets were expected to release steam. Still, mass hysteria turned a normal correction into a bloodbath in the short-term timelines and a generational buying opportunity when viewed from a long-term perspective.
Typically, the markets would pull back sharply and then tread water until our indicators moved into the highly oversold ranges. If the sentiment is still trading in the maddens zone when our technical indicators hit the extremely oversold ranges, there is a 90% chance that it will trigger the father of all buy signals.
There is one massive indicator validating the outlook that this current makes for a great opportunity. It’s insider activity, and the readings on this indicator are off the charts.
Insiders have been using this massive pullback to purchase shares, and one way to measure the intensity of their buying is to check the sell-to-buy ratio. Any reading of 2.00 is considered normal, and below 0.90 is considered as exceptionally bullish. So, what do you think the current ratio is; well, it’s at a mind-numbing 0.35, which means these guys are backing up the truck and purchasing shares.
So what are the readings today? Based on very heavy transaction volume, Vickers’ benchmark NYSE/ASE One-Week Sell/Buy Ratio is 0.33, and the Total one-week reading is 0.35. Insiders are not just buying shares; they are devouring shares. Insiders behaved in a similar fashion in late December 2018, after stocks crashed on Christmas Eve; in early 2016, when stocks also corrected; and in late 2008/early 2009, at the depths of the Great Recession correction. Those were spectacular times to buy stocks. Insiders seem to be telling us that today offers a similar opportunity. https://yhoo.it/2TV0cE2
Unleashing the Potential of Anxiety Sensitivity Index in Market Analysis
The anxiety sensitivity index is one of the most effective indicators for measuring euphoria and extreme mass stress/fear in the market. Ideally, the readings should fall within the severe range on either spectrum. Significant turning points in the market can be identified by combining this data with our sentiment indicators, which include the bears, the bulls, and the neutral individuals.
Markets often experience crucial shifts when bullish sentiment trades within the 50-55 range, with higher readings being more significant. High bullish readings are commonly associated with market tops. The same principle applies to extreme bearish readings, often indicating market bottoming action. A reading of 50-55 suggests that the crowd is in total panic, meaning a potential buying opportunity from a long-term perspective.
An interesting development occurs when neutral readings surge into the 50-55 range, with higher readings being more impactful. This surge signifies extreme uncertainty, as bears and bulls are unsure of their next moves, leading them to avoid the markets. It represents a form of learned helplessness. This phenomenon was observed from 2009 to almost 2018, when the stress and shock caused by the housing collapse instilled frozen fear in many investors, causing them to shy away from the markets for extended periods.

Compelling Pieces Worth Delving Into