
Interesting Charts: A Deep Dive into the Art of Trading Analysis
Updated July 21, 2024
Introduction: The Power of Long-Term Charts and Mass Psychology
Charts are potent tools in financial markets for gaining insights and making informed decisions. When used strategically, charts can potentially enhance your success rate by up to 90%. This is especially true when focusing on long-term charts’ wisdom and mass psychology’s insights.
As Warren Buffet famously said, “The stock market is a device for transferring money from the impatient to the patient”. Long-term charts, spanning at least 12 years and preferably 20, offer a clear view of market trends, filtering out short-term noise. They provide a stable foundation for analysis and decision-making.
Combining long-term charts with mass psychology adds another layer of sophistication. Understanding the market’s collective sentiment is crucial. As Benjamin Graham, the father of value investing, once said, “The investor’s chief problem—and even his worst enemy—is likely to be himself.” When the market is extremely oversold on monthly charts and coincides with high bearish sentiment (ideally 50 or higher), it presents a compelling buying opportunity.
Furthermore, recognizing patterns across various markets amplifies the likelihood of success. As legendary trader Jesse Livermore noted, “Patterns repeat because human nature hasn’t changed for thousands of years”. Observing patterns across different markets provides a comprehensive view for making informed decisions.

Unveiling Market Sentiment: Candlestick Patterns and Sentiment Analysis
Candlestick patterns and sentiment analysis are potent tools for deciphering market psychology and investor sentiment. By understanding these concepts, traders can gain valuable insights into market trends and potential reversals and make more informed trading decisions.
Candlestick patterns, such as morning star, evening star, shooting star, inverted hammer, and doji cross, provide visual cues about shifts in market sentiment. For example:
The morning star pattern, consisting of three candlesticks, appears during a downtrend and suggests a potential reversal to an uptrend.
The evening star pattern of three candlesticks appears during an uptrend and hints at a potential reversal to a downtrend.
The shooting star and inverted hammer patterns, with long upper shadows and small bodies, indicate struggles between buyers and sellers and potential trend reversals.
The doji cross pattern, which resembles a cross shape, suggests market indecision and a possible significant reversal or consolidation.
Sentiment analysis complements candlestick patterns by gauging investor psychology through various indicators. The Volatility Index (VIX), known as the “fear index,” measures market volatility and investor expectations. A high VIX indicates increased fear, while a low VIX may show complacency. The put/call ratio compares the trading volume of put options to call options and can also provide insights into investor sentiment. A high ratio suggests a bearish sentiment, while a low ratio may indicate a bullish sentiment.
Surveys and sentiment indexes, such as those measuring the outlook of professional investors or financial advisors, can further help understand market sentiment. High levels of bullish sentiment may signal market tops, while excessive bearish sentiment can suggest market bottoms.
By combining candlestick patterns, sentiment analysis, and other technical indicators, traders can gain a more comprehensive view of market behaviour. Overlaying sentiment indicators on price charts or using sentiment-related indicators like moving averages can help identify potential turning points or confirmation signals.
As legendary traders and investors have noted, understanding market psychology is crucial for success. Jesse Livermore emphasized that speculation is not for the “stupid, mentally lazy, or emotionally imbalanced,” while Warren Buffet highlighted that risk comes from not knowing what you’re doing. By mastering candlestick patterns and sentiment analysis, traders can navigate the markets with greater insight and make more informed decisions.
Navigating the Financial Landscape: Behavioral Biases and Market Indicators
Behavioral finance has revolutionized our understanding of investor decision-making and market dynamics. By exploring the fascinating patterns that emerge on charts and recognizing the role of cognitive biases, investors can gain a deeper understanding of market movements and uncover hidden opportunities.
Studies have shown that investors are prone to various behavioural biases that can influence their financial decisions. Confirmation bias, for example, leads investors to selectively focus on information that confirms their existing beliefs while ignoring contradictory evidence. This bias can contribute to the formation and persistence of market trends and exciting chart patterns. Anchoring bias, on the other hand, causes investors to rely heavily on an initial piece of information when making subsequent judgments, leading to irrational decision-making.
Herd mentality is another prevalent bias in investing, where individuals tend to follow the crowd’s actions and decisions. This bias can drive market trends, resulting in bubbles or crashes and influence the interpretation of chart patterns. As legendary investor Peter Lynch once said, “Go for a business that any idiot can run – because sooner or later, any idiot probably is going to run it.”
To navigate the financial landscape effectively, investors can combine insights from behavioural finance with market indicators. Moving averages, for instance, offer insights into the average price over a specified period, highlighting trends and potential support and resistance levels. The Relative Strength Index (RSI) measures the speed and change of price movements, helping investors gauge whether an asset is overbought or oversold. The Moving Average Convergence Divergence (MACD) indicator identifies potential trend changes and provides signals for strategic decision-making.
Renowned philosopher Plato once said, “A good decision is based on knowledge, not numbers.” This wisdom underscores the importance of understanding the psychological factors that drive market behaviour. Jesse Livermore, one of the greatest traders in history, noted, “The market is never wrong. Opinions often are.” Investors can make more informed and rational decisions by studying interesting charts, considering market indicators, and being aware of their behavioural biases.
According to a study by Barber and Odean (2000), overconfident investors trade more frequently, leading to lower returns. Another survey by Ruggeri et al. (2020) replicated patterns of prospect theory, showing how investors make decisions based on potential gains and losses rather than outcomes. These findings highlight the significant impact of behavioural biases on investment outcomes.
Let’s briefly take a historical look at the situation. Those who don’t learn from history are doomed to repeat it. By learning from it, you can take advantage of similar patterns in the future if they present themselves.
Interesting Charts 1: The Monthly Chart Of QQQ
April 7, 2023
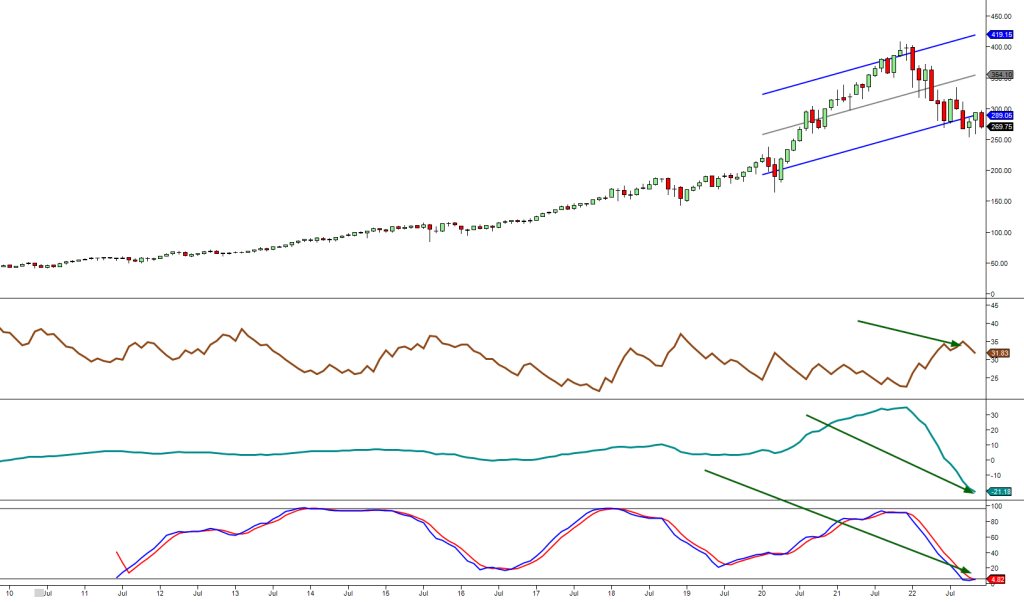
One of the exciting charts we’ll explore includes three indicators. The first assesses trend strength specific to a given stock, and the more significant the divergence, the more promising the trend. The second detects positive or negative divergences, with positive divergences indicating higher prices. For example, a stock trades to new lows, but the indicator puts in a higher low. The third indicator measures extreme trading levels, with the lowest reading in almost 13 years. Notably, the Monthly Chart of QQQ reveals that the most crucial criterion for a FOAB was triggered. MACD trading at its lowest level over 14 years is a significant bullish development.
The Monthly Chart of QQQ
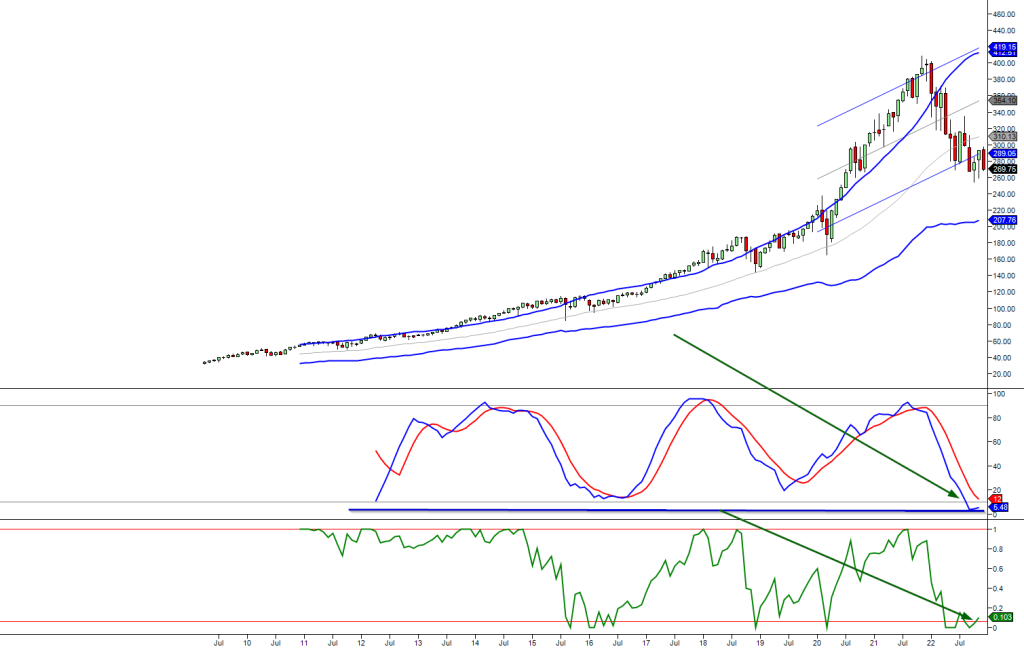
The two charts have differing sets of indicators. However, the most critical criterion for a FOAB was met as the MACD traded to at least a 12-year low, and it’s currently at its lowest level in over 14 years. This alone is an optimistic (bullish) development.
Conclusion
Combining technical analysis, mass psychology, and behavioural finance insights can be a powerful approach to navigating the stock market. Technical analysis tools like moving averages, RSI, and MACD help identify market trends and potential opportunities. Mass psychology provides valuable insights into market sentiment and investor behaviour. Behavioural finance concepts, such as confirmation bias, anchoring bias, and herd mentality, highlight the impact of cognitive biases on investment decisions.
The Monthly Chart of QQQ showcases a promising bullish development, with the MACD reaching its lowest level in over 14 years. This exciting chart pattern and other technical indicators can offer valuable insights for traders and investors.
Studies have shown that understanding and managing behavioural biases can improve investment outcomes. Overconfident investors tend to trade more frequently, resulting in lower returns. Prospect theory demonstrates how investors decide based on potential gains and losses rather than outcomes.
Investors can develop a comprehensive market understanding by integrating technical analysis, mass psychology, and behavioural finance. This approach allows for more informed decision-making and the potential to uncover profitable opportunities. As legendary trader Jesse Livermore stated, “The market is never wrong. Opinions often are.” Focusing on data-driven insights and managing cognitive biases can help investors navigate the dynamic world of finance with greater confidence and success.