
1929 Crash Chart: Conquering Market Fears with Data
May 31, 2025
Introduction:
Fear sells. And in bear markets, it’s wholesale.
But fear isn’t data. And data doesn’t panic.
The legendary 1929 crash chart gets pulled out every time markets hiccup—as if history’s worst-case scenario is always just one bad week away. The problem? Most people stare at that chart through a distorted, emotion-laced lens. They forget context. They ignore recovery arcs. They discount the resilience of capital markets, and more importantly, they forget what panic buys: opportunity.
Here’s the core truth: The market is not the economy. It’s the collective psyche of millions, oscillating between greed, fear, and hope. If you understand that, you realise crashes aren’t just chaos—they’re recalibrations.
This is where mass psychology collides with contrarian strategy. And where disciplined investors eat well.
Crash Survival Tactics: Navigating the Turbulent Market Storm
Crashes don’t kill portfolios. Emotional overreaction does.
Most view market crashes as catastrophic endpoints. That’s lazy thinking. In reality, they’re setups—snapbacks in disguise. The louder the crowd screams doom, the clearer the contrarian signal. Remember, the herd is only right at the start of the party or after the slaughter.
Case in point: Every crash you feared—from 1987 to 2008 to 2020—was followed by a generational opportunity. But only for those who didn’t flinch.
The trick isn’t timing tops or bottoms—it’s seeing through the fog. When people dump assets blindly, fundamentals get temporarily dislocated from price. That’s your cue. Not to guess, but to prepare. Tactical buying during fear requires planning, not luck.
Get your game plan in place before the storm hits. Watch sentiment. Track indicators like RSI, VIX, and MACD. And most of all—don’t freeze. Freeze and you join the casualties. Act with a plan, and you join the survivors who thrive when the dust clears.
Data, Technicals & Collective Behaviour
The 1929 crash wasn’t just a market collapse—it was a mass psychology meltdown writ large. Prices plunged as fear took over, and the crash chart became a legendary warning sign for a lost generation. But raw emotion wasn’t destiny—data and technical indicators tell a deeper story.
📉 Technical Snapshot: RSI, MACD & VIX in the Great Depression
While we don’t have RSI readings from 1929, analogues and historical momentum indicators tell us enough:
- RSI analogues likely hit extreme lows—early 1930s data shows extended oversold territory, where prices swung far below median trends.
- MACD-type signals, based on shorter vs longer moving-average divergences, would have flashed bearish crosses early and bullish turns after the washout.
- VIX didn’t exist, but modern equivalents tracking volatility spikes show that this crash triggered stress levels off the charts—something like 80+ on VIX in 2008 and 2020—signalling the crowd’s panic had peaked.
Recovery: A Marathon, Not a Sprint
Recovery after the 1929 crash was gruelling:
- A $10,000 investment made in July 1929 – before the fall – hadn’t returned to breakeven even after 12.5 years
- Average bear markets since 1929 lasted around 11.4 months, but full recovery often stretched to 2.5 years or more (investopedia.com).
- In contrast, the 2020 COVID crash rebounded in under a month, showing how interventions have accelerated modern recoveries (investopedia.com).
The Psychology + Technical Convergence
- Mass panic followed by technical capitulation
In 1929, RSI analogues signalled deeply oversold conditions, much like silent alarms. Later, MACD crossovers signalled momentum shifts—you don’t buy on raw fear; you buy on evidence of reversal. - Collective delusion and its unravelling
Crashes happen when everyone stops asking questions. Fear floods in, fundamentals are overlooked, and valuations become disconnected from reality. Technicals don’t just confirm that—they time it. Fear triggers oversold technicals. Technicals validate fear. Then the contrarian moves. - Action when indicators align with behaviour
When market emotion peaks—VIX-like spikes, RSI analogues < 30, MACD bearish, then bullish—the tactical window opens. That’s your cue: prepare to enter smart, strong positions that were sold irrationally incrementally. The market doesn’t demand perfection. It rewards preparedness.
🎯 Tactical Takeaway: Learn from 1929 in 2025
- Don’t freeze when the pain strikes. The best action often starts with filtering out fear.
- Track the mood and the math: Watch crowd panic (e.g., sentiment surveys or volatility proxies) and confirm with technicals (RSI oversold, MACD crossover).
- Plan incrementally: The 1929 recovery took years. Your entries should too. Each bounce validates your thesis. Each dip offers a tactical layer.
History shows crashes wipe out not just capital—they strip emotion, reset valuations, and eventually reward those who hold conviction and follow the technical clues. By blending those signals with a fearless acceptance of mass behaviour, you craft an edge sharper than 1929 fear charts—and far more powerful.
Bullish on Crashes: What the Dow’s Long-Term Chart Tells You
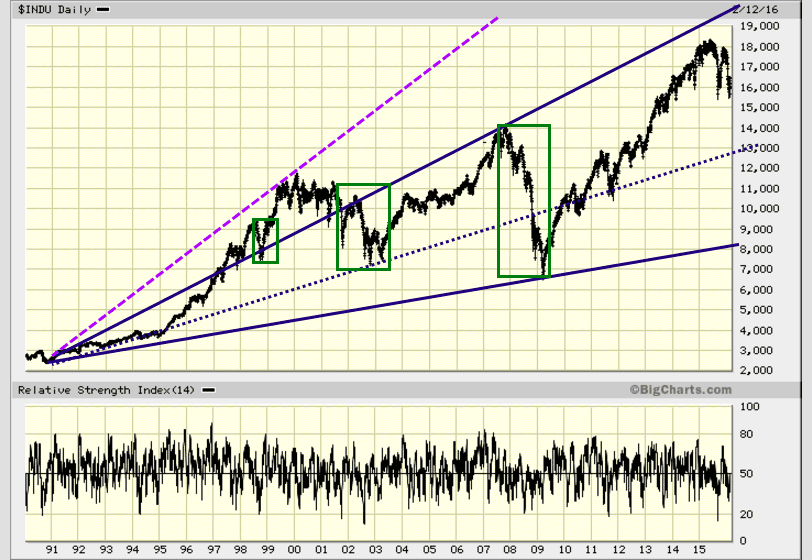
Forget the noise. This chart—from 1990 through 2016—doesn’t lie. Every so-called disaster was a disguised opportunity. The solid navy uptrend line represents the primary bullish path. The dotted one? A nod to the sceptics. Either way, the conclusion is brutal and clear: the deeper the deviation from trend, the bigger the profit window.
Look at the three green-boxed crash zones:
- Late ’90s bubble burst
- 2008 financial collapse
- 2011–2012 volatility spike
Each was marketed as the “end.” Each became a springboard. If you bought into fear, you missed generational wealth runs. But if you trained your eye on structure over sentiment, you won.
Calling the Bluff: The Doom Merchants Never Made Anyone Rich
Who profited between 1990 and 2016? Not the permabears. Not the newsletter hawks selling end-of-days strategies. The bulls who ignored hysteria and followed the trend came out ahead by miles. The only thing the “Doctors of Doom” are good at is selling panic to the untrained.
And here’s the kicker: the purple dotted trendline, more aggressive than the navy one, projected the Dow to break 25,000+. Ridiculous? Tell that to 2017 and beyond. These lines weren’t guesswork. They were built on internal metrics, not tea leaves or TV noise. And those metrics never screamed “run,” even during chaos. They whispered, “Hold your fire… then strike.”
Tactical Rule: Crashes Are Not Catastrophes. They’re Price Adjustments.
1987? A blip. 2008? A reload. Every so-called disaster is a replay of the same pattern—panic, purge, rebound.
- Volume spikes
- RSI extremes
- V-bottoms that bleed the weak hands
You want to know what works? Track the mood of the masses, then overlay it with technicals that cut through emotion. This chart is your blueprint, not for prediction, but for preparation.
The takeaway? Ignore the fear merchants. Watch the trendlines—study RSI. Listen to the volume. And train your mind to treat panic as profit. That’s the only real edge left.
Unlocking the 1929 Crash: Seizing Historic Buying Opportunities
Crashes aren’t just chaos — they’re invitations. Invitations to step in when everyone else flees. But don’t rush. Deploying your capital all at once in a mature bull market? That’s rookie move number one. Instead, wait for the pullback, the moment the crowd turns cautious, and start nibbling in increments.
When blood is flowing in the streets, as is the case right now during this coronavirus pandemic, one should consider nibbling at stocks if one has a long-term perspective. Do not deploy all your funds in one short period, but deploy them in increments; this way, if the stock dips lower, your average entry price drops. Tactical Investor March 2020
The key is tactical patience. Bank some profits on the way up and keep reserves ready for when fear surfaces again. That’s how you ride the waves instead of wiping out on the crashes.
In turmoil, the long-term view is your most powerful asset. The Tactical Investor’s minimum holding period is usually several months, but in volatile conditions, we extend that horizon because the best gains don’t come overnight. Crises offer hidden gems, not the shiny, overhyped names everyone’s chasing.
As William Moulton Marston put it, “Every crisis offers you extra desired power.” Use it.
Cracking the Code: What COVID and 1929 Tell Us About Market Cycles
Look back at the COVID crash: a brutal selloff, yes. But also a reset that markets desperately needed. Back in July 2019, we warned the bubble was ready to burst — the crowd had hit euphoric levels. That forecast wasn’t a lucky guess; it was based on watching the mood shift and knowing the pendulum would swing hard.
It is not a long-term negative development, but if our hypothesis is valid, it could result in a sharp pullback over a short period, as over-exuberant individuals are the first ones to get nervous the moment it looks like the situation is changing. However, this pullback will be a blessing in disguise as there is not enough firepower to crash the markets, and the sentiment is far from bullish. Net-Net, this is a long-term positive development. Market Update July 2, 2019— Market Update, July 2019
Fast forward: that pullback was no crash by historic standards. It happened in an environment of uncertainty, without the usual bullish support. That rarity is a golden sign — one that points to an even bigger rebound ahead.
“The current market pullback offers a rare opportunity for 87-level stock prices. It’s unprecedented. That means the coming melt-up will be just as spectacular.” — Sol Palha
COVID Crash vs 1929: Lessons in Fear and Opportunity
In both crashes, panic caused top-tier companies to be sold at fire-sale prices — the baby thrown out with the bathwater. March 2020 showed us the market was oversold. Fear hung thick, but for those willing to see through the haze, opportunity screamed.
“Fear is in the air, and many strong companies trade at attractive levels. Compile a list of solid names you’ve always wanted to own, and start committing funds slowly. Or do what you’ve been doing—hoping for a different outcome while repeating the same mistakes. That’s the definition of insanity.” — Tactical Investor, March 2020
The lesson is brutal and clear: crashes that echo 1929 aren’t curses — they’re moments to be embraced with gusto. They strip emotion, reset valuations, and reward those who don’t flinch.

Final Note: Own the Long Game, Master the Madness
In turmoil, smart investors don’t panic—they plan. Deploy capital in chunks, lower your average cost, and stay patient. The short-term bloodbath? That’s just the clearing fire before the next bull run ignites.
Forget chasing the hype or dumping your chips at the peak. The real power lies in spotting hidden gems when everyone else is scared stiff. Protect gains, set stops, and always keep powder dry for the next opportunity.
Markets thrive long-term despite chaos. Your edge? Seeing through the noise, sticking to a plan, and playing the game with discipline, not gambler’s luck. This is how you turn fear into fortune.