
Velocity of Money: Accelerating Profits in the Markets
March 14, 2024
This analysis will examine the velocity of money (VM) and its implications for the current economic climate. We will begin with a historical perspective on the VM and its trends leading up to March 2023. We will then provide an updated view of the VM as of March 2023, considering recent economic developments and their impact on inflation and the economy’s overall health.
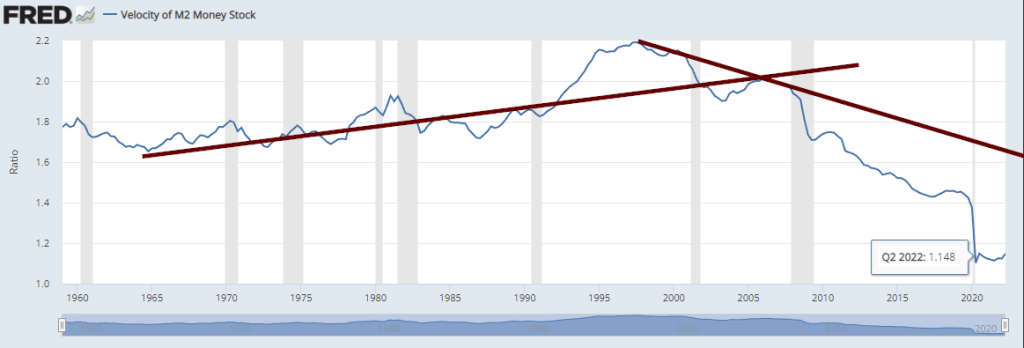
The above chart indicates that without constant money infusions, no long-term economy exists. A healthy economy has an upward-trending VM. The steep decline started after the Fed’s massive intervention in 2009. Since then, the trend has been negative; believe it or not, this is one of the best measures of real inflation (in a world that does not operate on “hard” money principles). A rising VM is usually associated with higher prices, but in this case, higher prices are generally warranted as a rising VM indicates that the economy is improving.
To illustrate the Velocity of Money in action, let’s consider an example scenario:
Suppose the actual output, representing the total value of goods and services, amounts to $9,000. Concurrently, the price level, which indicates the average prices of goods and services in the economy, stands at 2. Assuming the Velocity of Money, reflecting the speed at which money circulates through the economy, is 3, what would be the corresponding money supply?
To calculate the money supply, we employ the equation of exchange:
MV = PY
Where:
– M denotes the Money supply
– V represents the Velocity of money
– P signifies the Price level
– Y stands for Real output
Given:
– Real output (Y) equals $9,000
– Price level (P) is 2
– Velocity of money (V) is 3
Now, let’s substitute these values into the equation and solve for M:
M * 3 = 2 * $9,000
M * 3 = $18,000
By dividing both sides by 3 to isolate M, we find:
M = $18,000 / 3
M = $6,000
Hence, in this scenario where the real output is $9,000, the price level is 2, and the velocity of money is 3, the money supply amounts to $6,000.
The velocity of Money from Feb 2009
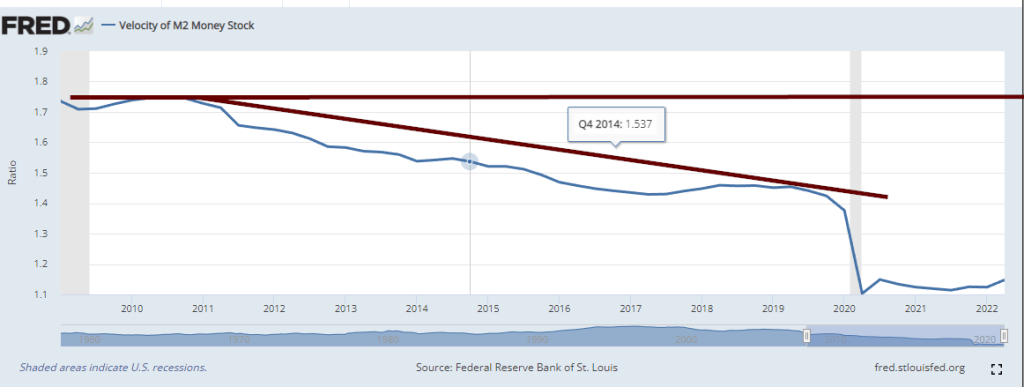
If you look at the above chart, the economy has been sick since 2009, indicating that no matter what the Fed states, it will continue to juice the economy with money. They intervene occasionally to create the illusion that they are doing the right thing. One can also then argue that almost every inflationary move since 2009 has been artificially created, as there has been no uptick in the VM.
The velocity of money from 1970 to 1982
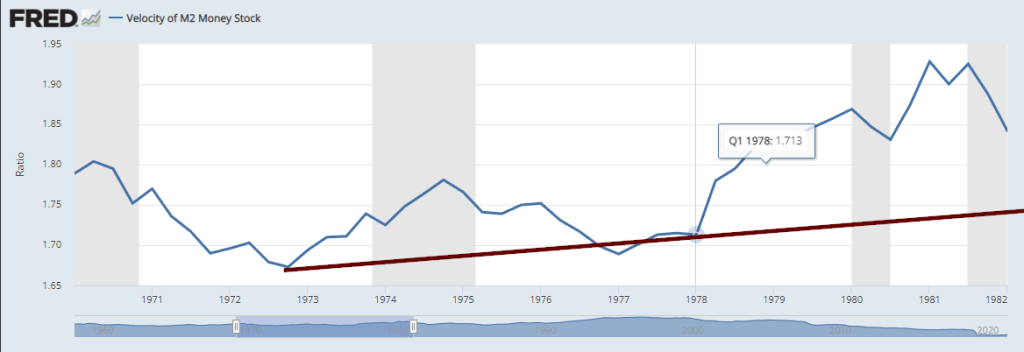
Now, look at the velocity of money during the inflationary period that started in the 70s and ended in the 80s. VM was rising. Yet since the advent of the internet (when it went mainstream roughly in the mid-90s), one could argue that inflation based on the VM formula has declined. One could also say that all the inflationary events had a specific trigger behind them, for example, limiting the supply of critical goods, disrupting supply chains, and using psyops to create the illusion that you need to buy now or lose big tomorrow.
The Tulip Mania occurred when complicated money principles were quite strong. If one knows how to use MP effectively, one could lay the groundwork to create inflationary forces in any market segment.
This is the danger of having large amounts of money; you can manipulate the trend by artificially using these massive amounts to create or destroy demand.
2024 Economic Outlook Through the Lens of the Velocity of Money
As we enter 2024, the economic landscape remains uncertain, with the velocity of money serving as a sobering barometer. The persistent decline in the velocity of M2 stock paints a grim picture—an economy teetering on the precipice, unable to find its footing amidst the relentless onslaught of macroeconomic headwinds.
If left unchecked, this worrying trend could catalyze a perfect storm of inflationary pressures, rendering the current market rallies mere mirages in a vast desert of financial turmoil. The data speaks volumes—most stocks languish below their 200-day moving averages, a stark reminder that only a select few titans are propping up the market indices, their dominance a double-edged sword that could prove unsustainable.
In this climate of uncertainty, Friedrich Nietzsche’s words resonate with profound clarity: “That which does not kill us makes us stronger.” The philosopher’s assertion that adversity breeds resilience could serve as a rallying cry for investors navigating these turbulent waters. Just as Nietzsche championed the virtues of perseverance and self-mastery, investors must also cultivate an unwavering resolve, embracing the present challenges as opportunities to forge a more resilient financial future.
Echoing this sentiment is the indomitable spirit of Jesse Livermore, the legendary trader whose exploits have etched an indelible mark on the annals of investment history. Livermore’s uncanny ability to read the ebb and flow of market sentiment, coupled with his unwavering conviction in the face of adversity, serves as a guiding light for those seeking to navigate the treacherous currents of the 2024 economy.
As money velocity continues to wane, Livermore’s mantra of “watching the market, not the ticker” takes on renewed significance. Investors would be wise to heed his counsel, eschewing the siren song of fleeting market fluctuations in favour of a more holistic, long-term perspective that recognizes the inherent cyclicality of economic forces and the necessity of patient, disciplined action.
In this challenging environment, investors’ true mettle will be tested. Those who emerge victorious will be the ones who embrace the wisdom of visionary thinkers like Nietzsche and Livermore, forging a path forward through the crucible of adversity and emerging stronger, wiser, and better equipped to capitalize on the opportunities that inevitably arise in the wake of every storm.
Decoding the Velocity of Money: Insights from Visionary Minds
The velocity of money, a metric that tracks the rate at which currency circulates within an economy, offers a unique lens into the underlying health and psyche of a nation’s financial landscape. As the data suggests, the current sluggish velocity indicates that the real inflationary threat may not be as severe as perceived. Instead, it unveils a more profound malaise – an economy unable to withstand the rigours of a normalized interest rate environment, a condition considered untenable in a truly robust system.
In dissecting this phenomenon, one cannot help but draw parallels to the seminal work of Sigmund Freud, the father of psychoanalysis. Just as Freud delved into the unconscious drivers of human behaviour, the velocity of money lays bare the subconscious impulses that govern economic activity. A stagnant velocity could be interpreted as a manifestation of collective financial anxiety, a hesitance to engage in the free flow of capital that underpins a thriving economy.
Peter Lynch, the legendary investor and mutual fund manager, would likely perceive this data as a clarion call for astute stock pickers. In an environment where macroeconomic forces may suppress the broader market, Lynch’s philosophy of identifying undervalued companies with solid fundamentals could prove invaluable. His mantra of “investing in what you know” is more significant when the overarching economic narrative is uncertain.
John D. Rockefeller, the titan of industry and one of the wealthiest individuals in modern history, would likely view the current velocity of money through the lens of opportunity. Rockefeller’s unwavering belief in the power of perseverance and long-term thinking could serve as a guiding principle for investors navigating these turbulent waters. Just as he weathered numerous economic storms throughout his illustrious career, today’s investors may find solace in his wisdom of maintaining a steadfast focus on long-term value creation.
Moreover, the insights of Aristotle, the renowned Greek philosopher, offer a poignant perspective on the velocity of money. In his treatise on ethics, Aristotle espoused the concept of the “golden mean”—the virtuous middle ground between two extremes. Applied to economics, one could argue that a balanced velocity of money, neither excessively high nor shallow, is the ideal state for a healthy and sustainable economy.
Money’s velocity is a powerful diagnostic tool, revealing the underlying currents that shape our financial landscape. By synthesizing the insights of visionary thinkers across disciplines, investors can gain a deeper understanding of the forces at play and chart a course towards prudent decision-making in an ever-evolving economic climate.
Leveraging the Velocity of Money for Market Timing
The velocity of money (VM) measures the rate at which money changes hands in an economy. It can serve as a valuable indicator for investors looking to time their stock market entries and exits. Historically, there has been a correlation between rising VM and bull markets, while declining VM has often preceded bear markets and recessions.
For example, during the high inflation period of the 1970s, VM was rising rapidly as money circulated quickly. This coincided with a strong bull run in the stock market for much of that decade before a sharp downturn in the early 1980s as inflation was controlled.
In contrast, since the 2008 financial crisis, VM has remained depressed despite the Fed’s efforts to stimulate the economy through monetary policy. The stock market has climbed over this period but very unevenly, with gains concentrated in a handful of large tech stocks while many other sectors have lagged.
Legendary traders like Jesse Livermore believed in using the crowd’s behaviour or “herd” to guide investment decisions. He would likely interpret a rapidly rising VM amidst widespread market euphoria as a signal of an impending top, presenting an opportunity to take profits. Conversely, a declining VM when pessimism is high could indicate the ideal time to start buying, as the masses are fearful.
However, investing greats like Vanguard’s founder, John Bogle, advocated a more passive, buy-and-hold approach rather than trying to time the market based on any single indicator. He might caution against placing too much weight on VM alone.
Warren Buffett’s longtime business partner, Charlie Munger, stresses patience and discipline. He would likely view a low VM environment as an opportunity to accumulate high-quality assets that are temporarily undervalued, with the expectation that economic conditions and VM will eventually improve.
In essence, while the velocity of money can provide valuable insights into economic momentum and market psychology, it should be just one factor in an investor’s decision-making process. A disciplined, long-term approach that can weather the market’s cyclical swings is likely most effective. Relying too heavily on any single indicator like VM for market timing could prove risky.
Other Articles of Interest

The Role of the Federal Reserve in US Economy

Embracing Challenges, Seizing Opportunities: Investing in China

Euro ETFs: Navigating the Investment Landscape

Short Dollar ETF: Navigating the Financial Markets
Why Is Freedom of Speech Important? Embracing It as Our Birthright

BBC Global 30 Index: Forecasting Profit or Peril

Enhancing AI Dangers Awareness: Understanding the Risks

Digital Currency Group: Leading the Way in Cryptocurrency Innovation
Denmark Anti-immigrant Ads: U.S. helpless against Russian hardware

Artificial Intelligence Investing is transforming investment strategies

The Patient Investor: Unveiling the Realm of the Strategist

Ishares robotics and artificial intelligence etf: A Financial Odyssey
Inflation Tax: Stealthy Threat to Middle-Class America

Mastering The Boom and Bust cycle: Buy High, Sell Smart

Unveiling Banking Scams: Deceitful Schemes Targeting the Masses