
DJU Index: Decoding Signals – Is it Flashing Bullish or Bearish in the Market?
Feb 21, 2024
Introduction: Intriguing Developments in the DJU Index
The Dow Jones Utility Average (DJU) Index, a price-weighted average of 15 utility stocks traded in the U.S, is a critical market indicator. It often provides valuable insights into the sentiments and potential movements within the equity markets. Recently, intriguing signals have flashed on the DJU charts, suggesting bullish tendencies despite an overall bearish market sentiment.
One such signal is the positive divergence on the weekly charts. A positive divergence occurs when the price of an asset is moving lower, but a technical indicator, such as the relative strength index (RSI), starts to move higher. This divergence can signal that the downward trend is losing momentum, and a bullish reversal might be on the horizon. For instance, despite the DJU’s downward trend in mid-2021, the RSI started to climb, indicating a positive divergence. Shortly after, the DJU saw a significant upward movement, validating the divergence signal.
Another crucial observation is that the DJU is oversold on the monthly charts. An oversold market condition often implies that the selling activity has been overdone, and a reaction, or even reversal, might be due. Historical patterns have shown that when the DJU is oversold, it tends to indicate higher prices for equities over the subsequent 6-9 month period. For example, in late 2018, the DJU was significantly oversold, followed by a robust rally in the equity market in 2019.
Dow Utilities Update: Positive Divergence Signal Triggered
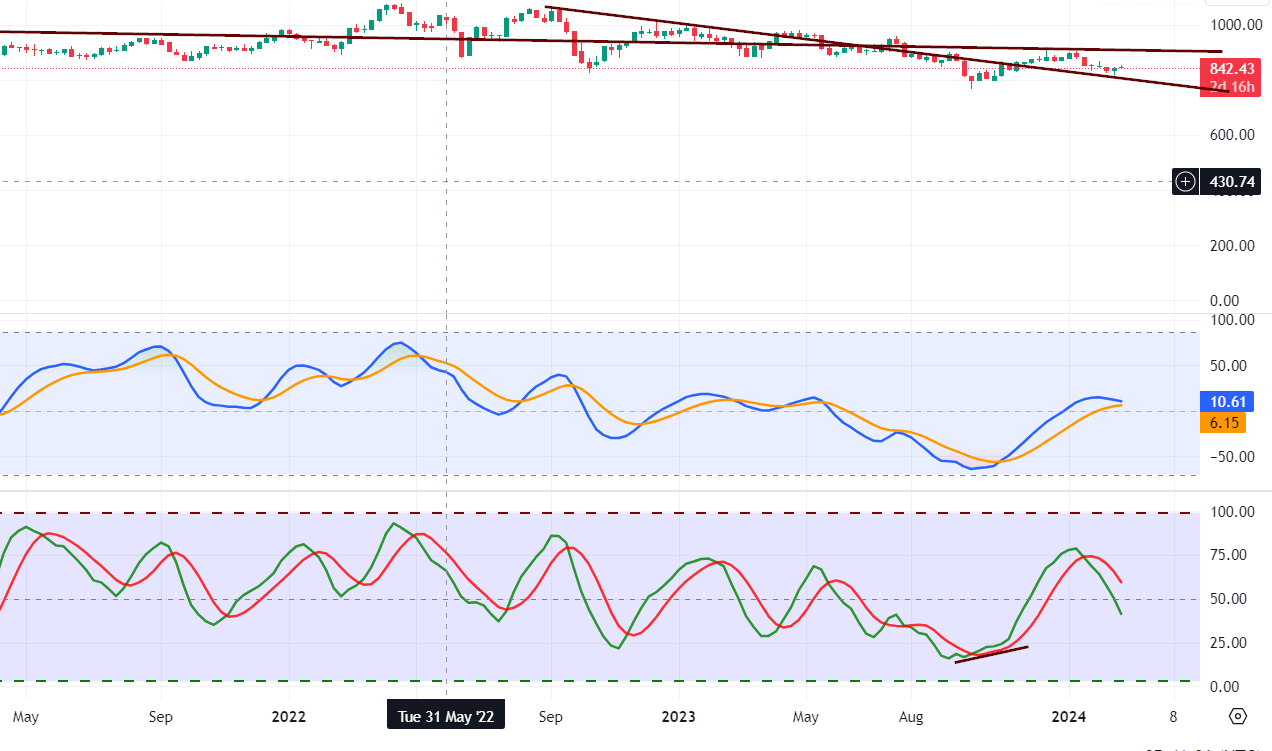 The DJU has produced a substantial positive divergence signal on the weekly charts. Although not as potent as a positive divergence signal on the monthly charts, it suggests that we should welcome any significant pullbacks until one of the following events takes place.
Short-Term and Long-Term Perspectives on IDU and DJU Indices
- Until the trend changes, however, the short-term trend won’t change for at least several weeks, and that’s the only thing that could change. The long-term trend would take months to change. Looking at historical records, the intermediate trend is unlikely to change for at least six weeks.
- IDU surges to the 86 to 90 range or DJU to the 990 to 1002 range. At that point, the situation would need to be re-examined to determine if the pattern on the monthly charts changed. The odds of the pattern changing are relatively low as the Dow Utilities are trading in the highly oversold zone on the monthly charts, as evidenced by the above chart.
Conclusion
In closing, the DJU Index is currently portraying cautious optimism. Key indicators, such as the positive divergence signal on the weekly charts and the oversold condition on the monthly charts, suggest a potential shift towards bullish sentiment. However, remaining patient and vigilant is crucial, as immediate, short-term trends may not drastically alter in the upcoming weeks.
The more gradual, long-term trend, typically unfolding over several months, underscores the importance of maintaining a balanced perspective. Historical data from previous years demonstrates a pattern where oversold conditions on the DJU often precede periods of rising equity prices, lending support to the current bullish outlook.
Keeping a close eye on the IDU and DJU indices will be integral, particularly for identifying specific range movements. A shift in patterns on the monthly charts would necessitate a thorough reassessment of the market outlook. Despite the possibility of change, the prevailing data suggests that Dow Utilities is currently situated in a highly oversold zone on the monthly charts, which has traditionally signalled a pending upward shift in equity prices.
A calculated and strategic approach is recommended when navigating prospective market transitions. A successful investor can skillfully balance immediate tactical manoeuvres and a strategic, long-term game plan.
Mental Treats For The Mind

Technical Analysis of Stocks and Commodities: Unveiling Insights

Why Is the US Education System So bad: Rubbish In, Rubbish Out Phenomenon

Investor Sentiment in the Stock Market Journal of Economic Perspectives

Mass Psychology of Fascism: Unmasking Bombastic News

Identifying Trends and Buying with Equal Weighted S&P 500 ETF

Real Doppelgangers: The Risks in the Age of AI

The Intelligent REIT Investor: How to Build Wealth with Real Estate Investment Trusts

TGB Stock Forecast: Rising or Sinking

Stock Market Crash Date: If Only The Experts Knew When

Reasons Why AI Is Bad: The Dark Truth?

The Inflationary Beast: Understanding What Inflation is and What Causes It

Carnosine Benefits: An Antioxidant for Health, Longevity, and Disease Prevention

Psychology of Cursing: Why Do People Curse So Much?

Spy 200-Day Moving Average: Covert Financial Indicator Unveiled

Black Monday Crash of 1987: Turning Crisis into Opportunity
When is the Next Bull Market: Unveiling Post-Crash Opportunities
