


The Trend indicator Anticipates Trend Changes In advance of the event
Updated May 8, 2024
How can we make such a claim? Well, the answer is simple. We live in a world where fraud, deceit and manipulation are viewed as desirable traits. There is no such thing as free markets today. Only fools believe in the concept of free markets. As they say, only God creates idiots, and only fools think they are Gods. In such an environment, you cannot rely on standard fundamental or technical analysis. All the data today is contaminated or manipulated. If the Feds stopped supporting the markets, they would collapse the very next day. Thus against this backdrop, the only thing that will work is if you have a way of determining the real trend.
That’s where the Trend Indicator comes in. If we had, to sum up, the trend indicator in one sentence, this is the statement we would make “a tool that magnificently combines the best elements of technical analysis with the key components of Mass psychology”.
The Trend Indicator has kept us on the right side of this Stock market Bull
Over the years, as one expert after another stated that the market was headed for a Crash, we, instead, stated the opposite. Fast forward in time, the Dow, as predicted, has gone on to put in a series of new all-time highs. Had you shorted the markets, you would have lost everything. The trend indicator even predicted that both a Trump win and Brexit would not unsettle the markets for more than a brief moment
After 2008, market manipulation took on a whole new meaning. Anything that could be would be manipulated. With this in mind, we knew we had to have an indicator that was operated on data that could not be manipulated. Fortunately, we had already been working on such a project, and the financial crisis pushed us into high gear.
The Noise Factor is eliminated
We needed and wanted an indicator that did not depend on or rely on so-called easily manipulated critical components such as volume, market internals, the number of new highs or new lows, moving averages of new highs or new lows, advancing or declining issues and a host of other data that was being manipulated. Volume is one of the critical backdrops of most technical systems.
We wanted a system that would never rely on such indicators or any other data that could yield false signals. We wanted an indicator that focused on price action and key psychological components but one that was also highly accurate.

This Indicator does not use data that is easily manipulated
With the trend indicator, the trend is recalculated on the hourly, daily, weekly, monthly and quarterly basis. For example on a daily chart, each bar represents one day of data, and on a quarterly basis, each bar represents one-quarter’s worth of data. We use mostly price data, some key psychological data that can be quantified and a few other key components that we calculate that are contamination-free. With the inception of the trend indicator, we no longer need to focus on the following
- There is no reason to identify critical market turning points in advance to know which direction the markets are headed. Many services issue targets, but if the target is not hit or broken, they conveniently provide an alternate scenario.
- This stress factor is eliminated from the equation with the trend indicator. As we already know the trend in advance, the strategy going forward is rather simple. If the trend is up, all pullbacks are viewed as buying opportunities and vice versa
- There is no need to sift through meaningless data such as market internals, market volume, advancing and declining issues, the Baltic Dry Index, Copper, and a host of other useless data. Once upon a time, this information was helpful and, in some cases, the key to determining market tops or bottoms; today, most of these indicators are on par with toilet paper.

Determine Market Tops and Bottoms in advance of the Event
Imagine never having to worry about what the market is doing. Knowing in advance if the market was topping or bottoming would be priceless. Envision knowing in advance that the so-called sharp correction the market is experiencing represents nothing more than a buying opportunity. It is not the end of the world as the Talking heads at CNBC or other self-proclaimed markets gurus proclaim. You do not have to visualise this anymore; there is such an indicator, and it does what it says.
Do not mistake market-topping and bottoming with predicting the exact top or bottom. We will not insult your intelligence by stating we have such a tool. We have a highly accurate tool in determining whether a market is going to top, bottom or continue trending upwards. With this knowledge in hand, you have the power to plan your moves. Fear and stress become relics of the past.
When you Know the Trend, You can ignore the noise
Once the distraction of trying to figure out where the market is headed is removed from the equation. One can focus on the most critical job of spotting the best plays poised to benefit from the current trend. Even if the data were not manipulated, knowing the trend in advance is simply priceless. Imagine how much more time you have on your hands to focus on trying to find the strongest plays to take advantage of the current trend. How much less stress do you have to go through? If you knew beforehand, the current downward move was just a pullback and not the beginning of a crash. You would react differently; you would not panic and join the herd as it jumps off a cliff.
With this knowledge, you would know in advance what strategy to employ. You would no longer be backed in the corner like a caged animal looking desperately for an exit. Instead, you would be calm, confident, and ready to act as you would have planned your moves in advance.
Knowledge is Power
Time would be on your side and not against you. The trend indicator has been backtested with 50 years’ worth of data, and in each case, it came out with flying colours. In every instance, it identified when a market was going to the top or bottom. In some instances, it was a bit too early, but we feel that it’s better to be early than late. Again, we are speaking of spotting a trend change, which means you might have to get in and out early.
We examine the Trend over several timelines (daily, weekly, monthly, quarterly, etc.). We devote most of our attention to the weekly and monthly trends. The hourly timelines are for short-term trend players such as day traders.
The trend indicator does not focus on the Drawing of Trendlines. Instead, we recalculate the trend for each time frame (hourly, daily, weekly, monthly and quarterly). This information is then combined with critical psychological data. The Trend indicator is not reliant on volume, market internals, or any other data that could be potentially manipulated. We have ceased to look at the volume or market internals, advancing or declining issues since we started to use this indicator, and the results are nothing short of remarkable. Look at some of our recent calls here.

Know The Trend In advance
Knowing the trend gives us ample time to find the stocks that will perform optimally under the present market conditions. This enables time to offer stock trades in several categories for free; most Financial services will charge for these extra features that the Tactical Investors provide for free. In many instances, these fees are double the cost of our entire service. With us, you get all this and more.
Resource (commodity) Plays: Momentum Plays: Insider Plays: Value Plays: Seasonal Plays: Trend Plays
We can fine-tune the selection process in each instance by utilising the trend indicator and several of our other top-rated tools. The section titled “Tactical Investor Tools” provides an overview of the tools we employ. Leave the market analysis to us and spend time doing things that bring joy to your heart instead of wasting it on things that might heighten your fear. As the market direction is no longer an issue, you can sit back and enjoy the ride.
Some Examples of The Trend Indicators in Action
Let us look at some real-time examples of the trend indicator in action. The red arrows in the charts are profit points for traders with short to medium trading time frames. We focus on the long and very long-term timelines but will always provide suggestions for traders with shorter horizons. Concentrating on long-term timelines does not mean we always hold a position for an extended period; we tend to hold onto positions for under six months.
We use long-term timelines to base our entry and exit points on; in other words, the analysis is based on applying the trend indicator to weekly and monthly charts. Blue arrows indicate buy signals based on the trend indicator, and red arrows indicate sell signals based on the trend indicator. As you will see from the numerous examples below, we are not looking to spot the ultimate bottom or top. In most cases, the signal turned bullish before a bottom and bearish before a top was in place.
“Bears win sometimes, and Bulls win sometimes, but pigs are always killed”.
The point we are trying to make here is that our goal is not to spot tops or bottoms or fixate on trend lines and worry about when the stock might or might not top or bottom. Our goal is to enjoy the ride up and or down until the signal changes, and that is it. With this strategy in place, investing is an extremely pleasurable venture.
We will start off with FXI (IShares FTSE/Xinhua China 25 Index), one of the much larger ETFs. Even with this large ETF, you can see how beautifully and seamlessly the trend indicator works.
If you were following the principles of trend line investing, you would have waited for SOHU to break out above the black downtrend line (the breakout point indicated by the green arrow). However, the trend indicator turned bullish almost three years earlier and, along the way, generated additional buy signals, as shown by the blue arrows. The trend indicator allows you to lock in significantly larger profits while at the same time focussing on the natural trend at hand, as opposed to trading based on news or wrong perceptions.
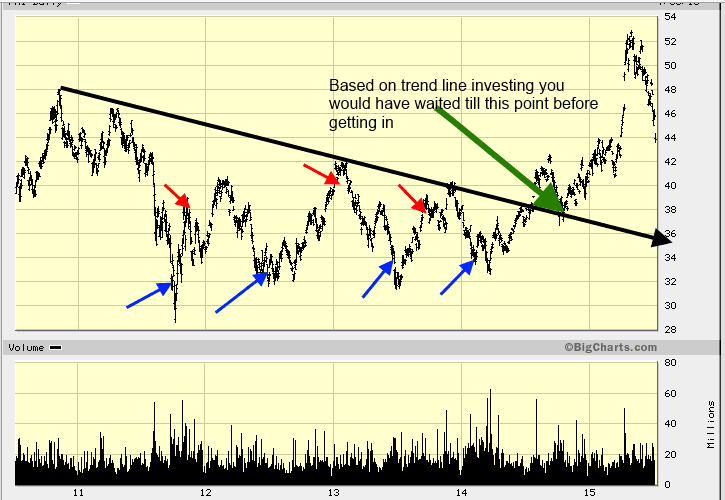
You would have been able to open a position in 2011 at around 32, instead of waiting until 2014 to get in at around 39.00-40.00. Additionally, you would have been able to add to your position along the way, as indicated by the additional blue arrows. Short-term traders would have been able to bank profits, as noted by the Red Arrows. Moreover, they could re-open new positions based on the blue arrows. On every occasion, we neither managed to get in at the exact bottom nor out at the actual top. This never was and never will be our strategy. Due to their size, large ETFs and large stocks cannot deliver the same gains as smaller-cap stocks. The gains would be significantly larger if you had opened positions in strong stocks such as CHL, NTES, SOHU, etc. Let’s take a look at SOHU and NTES.
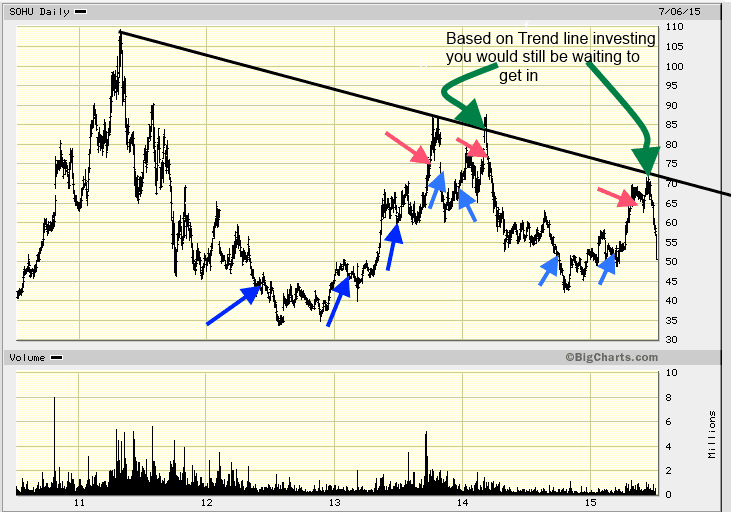
You would have been able to open your first position in SOHU in early 2012 & continuously add to it till 2015. Along the way, you would have taken profits, as indicated by the red arrows. If you followed trend-line investment protocols, you would still be waiting to get in. Notice again: we rarely managed to get in at the bottom or out towards the top; that is not the goal here. We aim to get in when the markets are issuing bottoming signals and get out when they generate signs of a top. We never attempt to time the exact top. If we do happen to time the actual top, we assign that to Lady Luck.
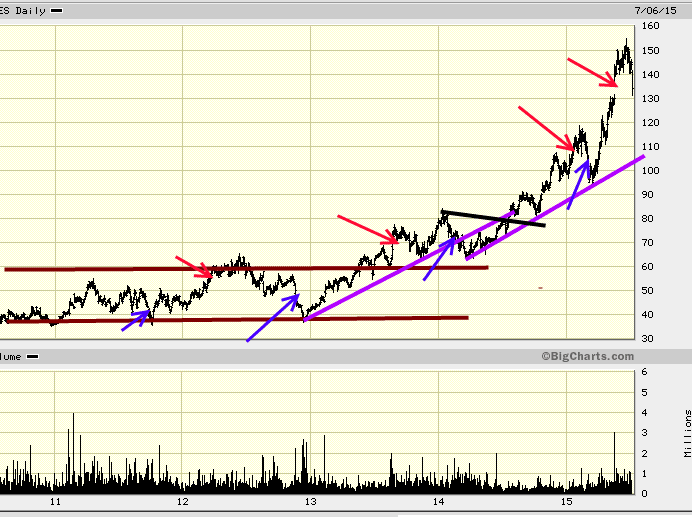
NTES triggered a bullish signal towards the end of 2011. After that, you would have gotten in and out continuously till 2015; along the way, you would have profits, as indicated by the red arrows. Again, we seldom got out towards the top & vice versa. We focus on catching the main move and not squeezing every cent out. The saying penny wise pound foolish comes to mind; the trend is your friend, so do not fight it.
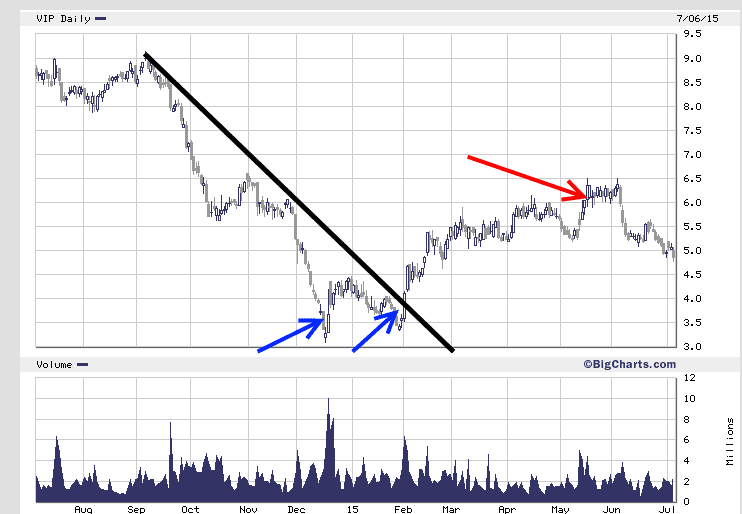
We opened our 1st position in Nov 2014 after the trend indicator turned bullish. In Feb 2015, the trend indicator flashed another (much more robust) buy signal. Shortly after that, the stock took off, and we bailed out around 6.30; while we managed to get close to the top, this was more luck than planning. Our goal is to open a position when the market starts to give indications of a bottom; this usually means we get in a bit early and vice versa. We aim to get in before the market takes off and out before it breaks down. We will not chase cents and give up dollars; that’s a recipe for disaster.
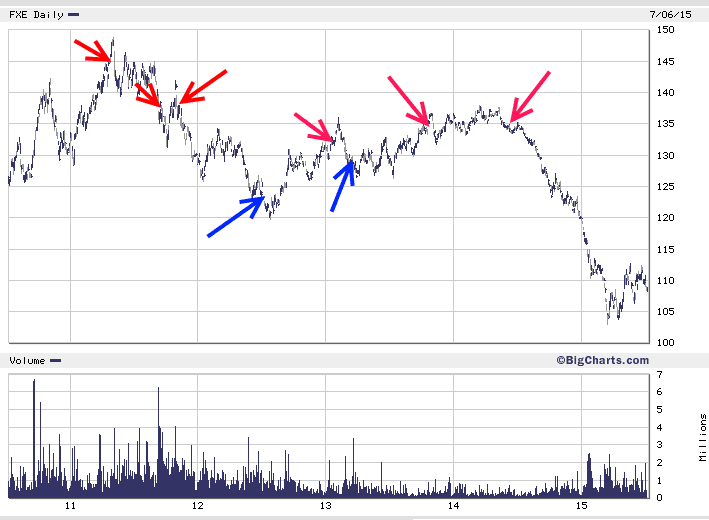

The trend indicator is also great for picking topping action.
The Euro generated sell signals in August 2011, which was valid as of Dec 2016. In between, we only had to buy signals as indicated by the blue arrows. Future traders, equity players and options players had many opportunities to short this market and walk away with massive profits. We locked in handsome gains by using the same strategy on Gold. In fact, in 2011, we turned bullish on the dollar, bearish on the Euro and bearish on Gold. Our subscribers closed their positions in Precious metals with the following results
Silver = profits more than 1000%
Gold = 700% plus
Palladium = roughly 800%
No more Guessing; this Great Indicator keeps you on the right side of the Market
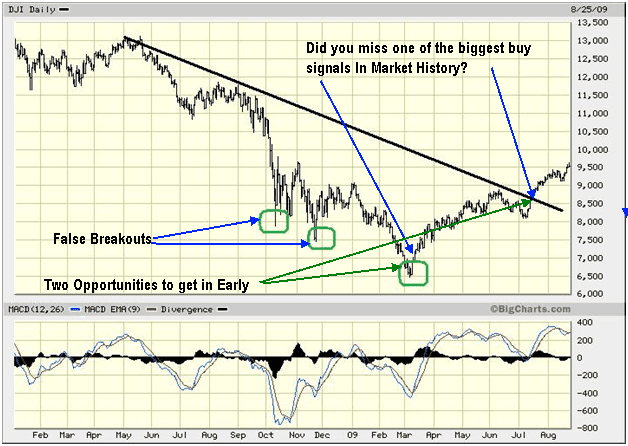
With the trend indicator, you would not have missed the most giant and most hated bull in financial history. Again, the indicator never picked the exact bottom or top. The markets remained volatile even after we had opened our first position in 2009. However, that did not deter us as we knew the trend was our friend. This indicator focuses on the long-term picture, so acid is only experienced over short-term time frames. With the Trend indicator, you will never focus on what the markets are doing over the short-term periods. If the Market drops lower, the idea is to buy more as long as the trend increases. This strategy has paid off handsomely, and we are in no hurry to change it. The investing strategy is straightforward and effective.
Looking for more info: look at the extensive list of our Market calls.

Other Topics of Interest


Why market crashes are buying opportunities
The Most Powerful Tool In Technical Analysis
