
Stock Market Trend Graph: Identify the Pattern and Take Action
Jan 28, 2025
Tracking a stock market’s upward and downward rhythms can feel like trying to tame a force of nature. Every shift, breakout, or reversal reflects layers of crowd psychology, corporate fundamentals, technological innovation, and shifting economic winds. With a proper understanding of a stock market trend graph, investors advance from guesswork to calculated decision-making. But that knowledge hinges on reading signals that an untrained eye might miss. This essay tackles the intricacies of spotting trends, interpreting chart patterns, and translating that insight into swift, confident action.
Charts are not mere shapes on a screen; they are the footprints of major financial institutions and everyday market participants. They reflect hope and fear, glut and scarcity. By learning to decode moving averages, watch for support and resistance levels, and pay attention to divergences in momentum indicators, you sharpen your ability to anticipate directional changes. In doing so, you step away from fear-driven speculation and move closer to a disciplined, goal-oriented approach. The key lies in weaving technical insights with a larger awareness of market mood—an interplay between data and emotion.
Seen through a historical lens, patterns have persisted across bull and bear markets for decades—rising peaks and troughs that mirror the cyclical nature of human sentiment. Yet modern traders also benefit from sophisticated charting tools, real-time data, and techniques that fuse advanced analytics with timeless human intuition. Anchored in this foundation, the following sections explore how to wield a stock market trend graph to bolster strategy and confidence, helping you to place decisive bets on your financial future.
Decoding the Basics: Simple Yet Powerful Indicators
Before wading into complex charting methods, it pays to master the basics. One of the most accessible tools is the moving average, a rolling calculation that smooths out short-term noise and provides a clearer view of a stock’s overall drift. When a short-term moving average crosses above a longer-term one, it can signal a change from bearish to bullish sentiment, or vice versa. With that single piece of data, traders gain glimpses into crowd momentum, opening the door to more shrewd entry and exit points.
Support and resistance lines are equally vital. A support line represents a price zone where buying interest historically outpaces selling pressure, often halting a decline. Conversely, a resistance line is where selling tends to overwhelm buying, containing an advance. These levels repeatedly reveal where buyers and sellers converge—data that can be especially potent for contrarian traders. Buying near a support line can yield lucrative gains if a rebound follows, while short-sellers might target positions around a stock’s key resistance area.
Combined, these concepts—averages and support/resistance—allow novices and veterans alike to map pivotal turning points. Rather than reacting to daily headlines or emotional impulses, traders can lean on structured evidence. This requires patience and awareness; in hindsight, anyone can recognize a line on a chart. The magic arises when you track these signals in real-time, gleaning cues about market psychology as events unfold. Though no single indicator guarantees success, layering multiple basic signals transforms guesswork into a more disciplined craft.
Unlocking Momentum: RSI, MACD, and Divergence Patterns
Once an investor understands the fundamental elements, the door opens to more refined momentum indicators. The Relative Strength Index (RSI) pinpoints overbought and oversold conditions, oscillating between values from 0 to 100. When it climbs too high, it hints that the stock may be overextended, ripe for a correction. Conversely, low readings can flag a bargain play, especially if fundamental factors remain constructive. Still, RSI is not an infallible formula; it must be interpreted within a broader context to avoid being misled by sudden news or short-term swings.
MACD (Moving Average Convergence Divergence) is another favorite among trend-followers. It tracks two separate exponential moving averages to highlight emerging shifts in momentum. Traders watch for signals such as bullish crossovers (when the MACD line rises above its signal line) or bearish crossovers (when it falls below). Seek alignment with price movement: if the stock’s price plummets but MACD shows signs of rising momentum, you may witness a divergence that foretells a potential reversal.
Beyond RSI or MACD, advanced traders often watch for various divergence patterns, from bullish to hidden divergences that suggest a continuation of an existing trend. Recognizing these patterns demands focus, practice, and a bit of intuition. Momentum indicators can provide early hints that a market’s psychology is shifting. When headlines pump fear but your charts reveal resilience—or vice versa—you may slip in ahead of the masses, capitalizing on the emotional swings that shape every market.
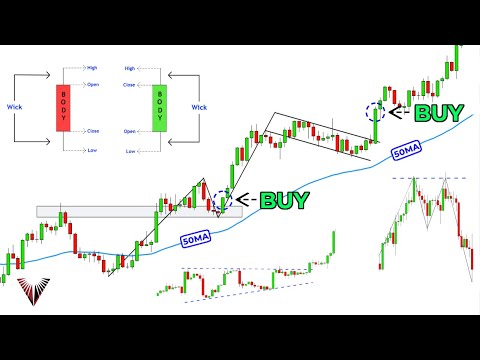
Chart Patterns: Head and Shoulders, Triangles, and Breakouts
Amid swirling price activity, certain shapes recur with striking regularity. Chart patterns like head and shoulders, double bottoms, ascending triangles, or wedge formations can offer robust clues about forthcoming moves. For instance, a head and shoulders pattern indicates a struggle between buyers and sellers, often culminating in a decisive break below the “neckline,” marking a potential downturn. By waiting for confirmation—a clear breakout—traders can avoid reacting prematurely.
Triangular formations deserve special mention, as they crystallize a battle between converging lines of support and resistance. Ascending triangles show an upward bias while descending triangles tilt in the opposite direction. Symmetrical triangles, the most neutral variety, imply a mounting tension that eventually snaps in either direction. The release of this tension can trigger explosive momentum, a crucial consideration for investors seeking high-reward trades. Observing volume data during these patterns is a complementary layer, as major breakouts typically occur on higher-than-average trading volumes.
Exploring chart patterns can sometimes feel like scanning the clouds for recognizable shapes. However, the market’s cyclical nature and psychological underpinnings make recurring patterns a product of repeated human behavior. Individuals anchored in these visual cues gain an edge. Rather than guessing if the stock will rise or fall, they interpret historical precedents highlighting possible breakpoints. Chart patterns rarely speak in absolutes, but their signals, technical indicators, and prudent risk management can set you leagues apart from the herd.
Integrating Fundamentals with Technical Observations
Though technical analysis can be deeply enlightening, few investors should ignore the fundamentals behind the tickers. After all, a chart will not protect you from a company mired in scandal or sustained losses if that reality undermines the bullish pattern. Savvy traders mesh chart reading with thorough fundamental research—evaluating earnings, understanding leadership, and tracking regulatory shifts that could derail even the most promising rally.
Consider a scenario where a stock’s chart patterns suggest an imminent breakout, supported by a strong RSI and a bullish crossover on the MACD. While the technical signals appeal, the investor checks the company’s upcoming earnings report, scours liquidity metrics, and gauges the overall sector’s performance. If the fundamental outlook aligns favourably, the conviction behind the trade soars, turning an otherwise risky gamble into a well-reasoned bet.
A dissonance between fundamentals and technicals can sound a warning. A chart could signal overbought conditions if the company’s narrative outpaces reality, leading to inflated valuations. Alternatively, the stock’s chart might appear oversold even as the business barrels toward meltdown. Closing one’s eyes to fundamentals can result in blind optimism or crippling hindsight. A balanced approach opens clearer pathways to success, allowing technical data to direct your short-term decisions while fundamental strength bolsters your long-term confidence.

Actionable Steps: Become a Master of Pattern Recognition
Reading a stock market trend graph is not an academic exercise; it should galvanize you to take bold yet calculated action. The first step is to practice. Rather than diving into live trades immediately, study historical charts of well-known companies or market indexes. Familiarize yourself with how RSI, MACD, and chart patterns appear in real data. Notice how these signals change when recessions loom or bull markets rage. This exposure breeds pattern recognition skills that cannot be acquired overnight.
Once you have tested your theories, consider using small positions or even paper trading while you refine your timing. Whether you choose swing trading, day trading, or long-term investing, a steady ramp-up in the application will cultivate discipline. Resist the urge to chase the latest hype or panic at every fluctuation. Instead, let your chart analysis guide your plan—entry points, stop-loss placement, and profit targets. Over time, you will learn how markets respond to common catalysts, including economic releases, earnings announcements, or interest-rate shifts.
Above all, remain flexible. If your indicators flash caution but the stock surges on unexpected news, be willing to adapt. Strong traders accept that pattern recognition is as much about eliminating false signals and limiting losses as it is about riding silver-bullet trades. Mastery of the stock market trend graph flows from a blend of analytics, emotional control, and readiness to pivot when conditions demand it. By forging that trifecta, you position yourself to act nimbly in a realm often swayed by fear, greed, and spur-of-the-moment impulses.