
Stock Market Psychology Chart: Your Emotional Investing Compass
⚡ “The wise profit where the foolish panic. The market does not reward fear—it exploits it.”
April 5, 2025
Welcome to the battlefield of the markets, where fear and greed wage an endless war. In this high-stakes arena, the unprepared become prey, and only those who master their emotions survive.
Imagine a map that exposes the market’s emotional undercurrents—the irrational exuberance before a crash, the despair before a surge. That’s the power of the Stock Market Psychology Chart. It’s not just a guide—it’s a weapon.
Confucius warned, “A man who cannot govern himself will be governed by others.” In the stock market, that ‘other’ is the crowd—blind, reactive, and dangerously predictable. Understanding mass psychology isn’t just useful; it’s the difference between profit and ruin.
This chart strips away illusions, revealing the rhythm of market sentiment. If you can read it, you can exploit the crowd, anticipate turning points, and act when others hesitate. Ready to stop reacting and start dominating? Let’s begin.
Navigating the Emotional Seas: The Stock Market Psychology Chart
The market isn’t driven by logic—it’s powered by panic, greed, denial, and hope. Data follows emotion. And emotion follows the herd.
The stock market psychology chart tracks more than price action. It tracks mass emotional volatility, mapping how sentiment surges and collapses across the cycle. It’s not a prediction tool—it’s a mirror, and most traders don’t like what it shows.
⬇️ The Predator’s Cycle visually distills the emotional evolution of markets—from despair to euphoria, and everything in between. ⬇️
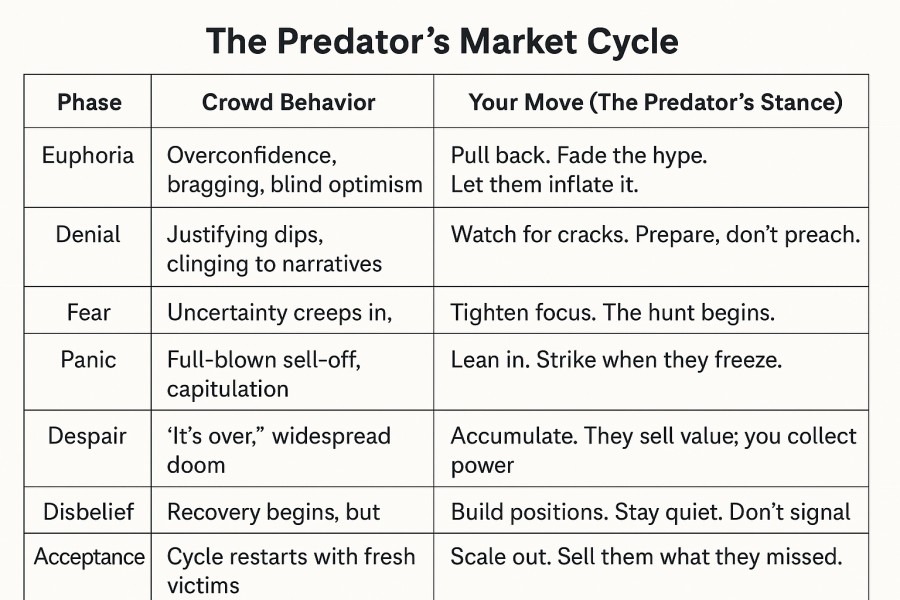
What It Shows
✅ Each stage represents a dominant emotional state that shapes investor behavior—regardless of valuation.
From stealth accumulation and disbelief to euphoria and capitulation, this cycle captures the predator-prey dynamics of market psychology.
Core Emotional Signals
Euphoria = herd blindness. Top is near.
Despair = crowd collapse. Opportunity is forming.
Hope = denial in disguise.
Neutrality above 55%? That’s not balance. That’s a crowd cracking from within. A freeze before the quake.
Contrarians don’t avoid these zones—they hunt them.
Weaponizing Sentiment: From Bias Trap to Tactical Edge
Most traders worship data. Few question the source of that data—human emotion. Fear, greed, hope, denial—they’re the fuel behind every chart spike and crash.
Stock market psychology charts expose this madness in motion. They’re not just visual tools—they’re extraction maps for the contrarian operator. Properly wielded, they help you:
Cut through noise by tracking sentiment evolution—not price action alone.
Detect reversals early when crowd emotion hits unsustainable highs or lows.
Spot hidden cracks—like rising optimism despite weakening technicals.
Avoid classic traps like overconfidence, herd mentality, and FOMO.
Trigger bold contrarian plays just as the herd throws in the towel.
Extreme Greed? Signal to prep your exit.
Panic? Likely near a bottom.
Neutral above 55%? Don’t get fooled. That’s not indecision—it’s psychological pressure cracking from within. That’s when real shifts begin.
Anxiety Index hitting extremes? You’re standing at the inflection point. Direction depends on how deeply fear has rooted.
Stop Trading Blind
Overconfidence shows up as low volatility, bullish surveys, and an eerie absence of caution. These aren’t signs of strength—they’re precursors to collapse.
If the chart shows euphoria detached from fundamentals, tighten risk. Lighten up into overbought highs. The crowd’s certainty is your cue to become uncertain.
And when the data screams fear—when media panic surges, when put/call ratios spike, and everyone’s screaming “sell”—start sharpening your blades.
Rules of the Game
Never bet on one signal. Corroborate with at least two more—sentiment, technicals, and macro context.
Avoid blind spots. Ask: What does the crowd believe—and what’s the cost if they’re wrong?
Don’t rush. Stagger in. Use stops. Expect fakeouts. Your job is survival, not perfection.
Size matters. Know how much red you can bleed before the trade turns toxic.
Bottom Line?
Charts don’t lie—but people do, especially to themselves.
Those who master sentiment don’t just read the chart—they read the herd’s delusions, then trade against them.
They don’t follow trends.
They hunt the minds behind them.
Why This Matters
This chart is a contrarian’s compass—one that tracks emotional extremes, not analyst forecasts. It becomes lethal when mapped with tools like our Anxiety Index, which detects crowd stress before price reacts.
It uncovers trend reversals before they’re priced in.
It neutralizes emotional decision-making.
It exposes market mirages others blindly chase.
⚡As John Templeton said, “Bull markets are born on pessimism… and die on euphoria.”
Your job is to see the funeral before the crowd shows up.
The Inner Workings of a Stock Market Psychology Chart: A Trader’s Secret Weapon
“To master the market, one must first master fear.” This is a lesson as old as commerce itself.
A stock market psychology chart is more than a visual aid—it’s a roadmap to human behavior in financial markets. The battle between optimism and fear is ancient, yet entirely predictable. The crowd panics at the bottom and cheers at the top, setting the stage for the next move.
The fear zone marks the moment of capitulation, where investors sell in despair, surrendering their shares at rock-bottom prices. This is when seasoned traders strike, accumulating assets while the masses retreat. Watch for spiking volume, sentiment gauges in extreme bearish territory, and sharp sell-offs stabilizing near support levels—these are the clues that a new bull market is gestating.
Hope fuels the early rebound as the cycle turns, and greed takes over as momentum builds. Euphoria blinds investors to risk, leading to reckless speculation and unsustainable valuations. What follows is inevitable—complacency invites collapse, and the cycle repeats.
Understanding this pendulum between irrational despair and reckless optimism gives traders a decisive edge. The psychology chart distills these emotional patterns, offering clarity in the chaos.
Conclusion: The Market Is a Mind Game—Master It or Be Played
The crowd panics. The crowd cheers. But the market? It moves for neither.
It hunts emotional weakness. It rewards mental clarity. That’s the game.
The stock market psychology chart isn’t a tool—it’s a weapon. A map of . A pulse monitor for the herd. It tells you when fear is ripe for exploitation… and when greed is about to collapse under its own weight.
Euphoria blinds. Panic exposes. Neutrality above 55%? That’s the fracture before the break.
Seneca said, “He who is brave is free.” In markets, bravery isn’t bold bets—it’s resisting your own biology. It’s acting on data while the mob drowns in dopamine and cortisol.
Michel de Montaigne nailed it: “The greatest thing in the world is to know how to belong to oneself.” The real investor does not chase or flee. They measure. They wait. They strike.
The market doesn’t reward emotion—it exploits it.
It rewards those who stay still when others stampede.
It crowns the few who use fear as signal—not threat.
You’re either tracking the herd… or tracking its vulnerability.
There is no middle ground.
Mastering Market Psychology: Weaponizing Emotional Cycles for Strategic Gain
Forget the myth: the market isn’t rational—it’s reactive, twitchy, and emotionally hijacked. The stock market psychology chart doesn’t track valuation alone; it maps mass behavioral fragility.
This chart captures the emotional arc of every market cycle—optimism, thrill, euphoria, anxiety, , despair, and false hope. Each stage fuels decisions that move billions—blindly. Your job? Exploit that.
From Chart to Compass: Decoding Emotion for Strategic Advantage
isn’t success. It’s the final hallucination before collapse.
Panic isn’t danger. It’s the moment the crowd gives you everything at a discount.
Despair is the origin of generational wealth—but only for those willing to buy when it feels like death.
Most investors buy euphoria and sell despair. That’s the cycle. Understanding the chart helps you do the opposite—with conviction.
Conditioned by Chaos
Like Pavlov’s dogs, markets are conditioned. Traders react not to logic, but to signals—Fed headlines, CPI prints, earnings surprises. Even algorithms exhibit behavioral tics, triggering cascades that have nothing to do with fundamentals.
This isn’t random—it’s programmable emotion. Recognize the patterns, and you can predict chaos before it unfolds.
Rational Thinking in an Irrational Arena
The chart isn’t a crystal ball. But it’s a behavioral radar. It shows when sentiment detaches from reality—when the crowd becomes a trade.
By pairing this with technicals and layering in proprietary sentiment tools like our Stupidity Index, and Bull/Bear Sentiment Index, we don’t react—we strike.
No Room for Speculators
Want to buy high and pray it goes higher? Join the herd. Want to sell low and beg for a second chance? The market will let you—for a price.
But if you’re willing to discipline emotion, invert the cycle, and weaponize fear—you’re already ahead of 95% of the crowd.
At Tactical Investor, we don’t chase narratives. We decode mass behavior. Then we act—with clarity, precision, and zero hesitation.