
The Stock Market Psychology Chart: Understanding the Emotions Behind Market Movements
Updated Jan 24, 2024
Stock market investing can be challenging for those unfamiliar with its fundamental rules. However, the path becomes much more manageable once you grasp these basics and adhere to them while avoiding speculative behaviour. Success boils down to discipline and patience, combined with a deep understanding of the fundamental components of mass psychology. If you complement this knowledge with technical analysis, you’ll refine your skills even further.
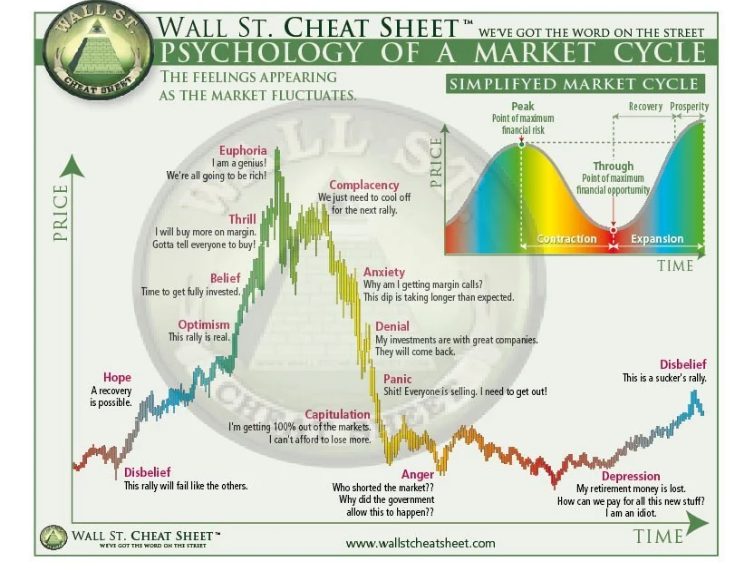
The stock market, often seen as a rational entity, is significantly influenced by the emotions of its participants. The stock market psychology chart vividly depicts this emotional interplay, a tool designed to help investors navigate the complex emotional landscape of different market cycles.
This chart visually represents the collective emotional states of investors at various stages of a market cycle. It typically includes stages such as optimism, excitement, thrill, euphoria, anxiety, denial, fear, desperation, panic, capitulation, despair, depression, hope, relief, and optimism again. Each stage corresponds to a specific emotional state that investors may experience as the market fluctuates.
For instance, during the thrill stage, investors often experience a rush of excitement as they see their investments rapidly increase in value. This stage is typically associated with a bull market, where stock prices rise. On the other hand, the panic stage is characterized by a sharp market downturn, leading to widespread fear and hasty selling among investors.
The stock market psychology chart is a practical application of Pavlov’s theory of classical conditioning. Much like Pavlov’s dogs, investors can be conditioned to respond to specific market indicators. A bullish market report, for instance, can trigger a conditioned response to buying more stocks, even if the underlying fundamentals of the stocks do not justify the increased buying activity.
Similarly, a bearish market report can trigger a conditioned response of panic selling among investors. Even the rumour of a negative report can cause market volatility, demonstrating how a neutral stimulus (rumour) can trigger a conditioned response (panic selling).
High-frequency trading algorithms also exhibit Pavlovian conditioning. These algorithms are conditioned to respond to specific market conditions or indicators, executing buy or sell orders when those conditions are met.
While the stock market psychology chart is not foolproof, it offers invaluable insights into the emotional dynamics that significantly influence market movements. It is an indispensable resource for any investor navigating the intricate and emotionally charged realm of stock market investing.”
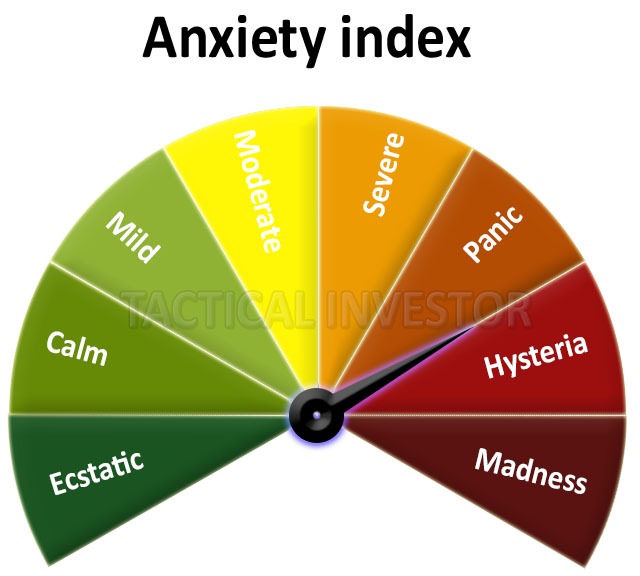
At Tactical Investor, we adhere to a straightforward philosophy. We harness the power of our exclusive tools, including the Anxiety Index, Stupidity Index, Bull and Bear Sentiment Index, and more. Our mission is to take on intricate analytical tasks and deliver precise guidance on when to initiate buying or selling actions.
Stock Market Psychology Chart: Navigating the Emotional Seas
The stock market is not just a place of numbers and charts; it’s a complex ecosystem where human emotions play a significant role. This is where the stock market psychology chart comes into play. This tool is designed to help investors understand and navigate the emotional currents that drive market movements.
The stock market psychology chart visually represents the collective emotional states of investors at different stages of a market cycle. The horizontal axis typically represents the market valuation relative to its fundamental value, ranging from oversold to overbought extremes. The vertical axis charts the prevailing emotional state, from fear and despair at one end to hope and greed at the other.
As the market ebbs and flows, so do the investors’ emotions. During periods of optimism and rising prices, emotions like denial, hope, and euphoria dominate. Conversely, anxiety, fear, and panic take hold when the market is in a downturn.
These emotional stages provide contrarian signals. Savvy investors leverage these signals to time their entries and exit counter to the crowd. For instance, when despair takes over after panicked selloffs, it often lays the groundwork for a new bull market. This is when behaviourists aim to buy more rationally when others capitulate irrationally.
The stock market psychology chart also acknowledges cognitive biases like overconfidence or loss aversion that can distort mass views during critical phases. Identifying divergences between emotional indicators and fundamentals can help foresee trend changes.
While it’s an inexact social science, plotting emotional patterns revealed within market fluctuations offers a contrarian lens for mitigating behavioral pitfalls through different cycles. Pairing sentiment readings with other analytical tools empowers investors to navigate the turbulent seas of mass opinion.
The Inner Workings of a Stock Market Psychology Chart
Understanding investor emotions is crucial, as greed and fear create self-fulfilling cycles influencing prices substantially over the long run. A stock market psychology chart monitors these primal emotions through distinct halves representing optimism versus uncertainty.
The fear area depicts periods bearing angst, with skittish investors hurriedly exiting equity positions. Major sell-offs frequently coincide with capitulation to the downside as pessimism breeds even more profound doubts. Monitoring sell-side pressure through expanded volumes and bearish sentiment gauges helps identify points of maximum distress.
Often forming bases just above support levels, fear areas lay the groundwork for new bull markets, according to behaviourists. Once fear transforms into hope, bargain hunters seek undervalued companies, forming the initial demand driving recoveries.
Meanwhile, greed involves euphoria and exuberance as excesses emerge on buoyant uptrends—extended rallies birth overconfidence, with investors rationalizing lofty valuations driven more by emotional contagion than fundamentals. Distribution events surface as more realistic appraisals of underlying strength take hold.
Together, these halves complete the market cycle pendulum, swinging between unsustainable pessimism and optimism in predictable waves charted against broad benchmarks. The chart distils these emotive patterns, aiding wise portfolio stewardship amid inevitable fluctuations in mass sentiment.
What are the benefits of using such charts?
Here are some key benefits of using stock market psychology charts:
– Helps tune out noise and remain objective. By analyzing how sentiments evolve, investors can avoid panicking during sharp downturns or exuberance in massive rallies.
– Identifies trend changes earlier. Emotional extremes illustrated on the chart often signal market tops and bottoms before prices fully reverse. This gives a timelyheads up on potential trend changes.
– Prevents chasing momentum. The chart depicts when buying interest switches from fear to greed. This helps traders avoid euphoric, late-stage positions with expensive entries.
– Reduces behavioural biases. Visualizing how biases like overconfidence distort thinking at peaks encourages more rational decision-making aligned with fundamentals.
– Promotes contrarian thinking. Recognizing when prevailing views have become too optimistic or pessimistic inspires trades, countering the herd for superior risk adjustment.
– Enhances portfolio discipline. Using sentiment as an additional factor fosters systematic processes for rebalancing exposures rather than panicked reactions to short-term swings.
– Highlights multi-year cycles. Charts illustrate recurring patterns of emotion during the Bull and bear eras, helping form realistic long-term expectations.
Capturing the full spectrum of market sentiment promotes patience, optimal agility and performance through bull-bear market rotations.
What are the common emotions that drive market movements?
In addition to fear, greed, optimism, pessimism, and panic, several other emotions significantly influence market movements. These include hope, regret, pride, and overconfidence.
Hope is a powerful emotion that can lead investors to hold onto losing positions for too long, believing that the market will eventually turn around. This can result in significant losses if the market continues to decline.
Regret, on the other hand, can cause investors to sell winning positions too early out of fear that they will lose their gains. This can prevent them from fully capitalizing on successful investments.
Pride and overconfidence can also be detrimental. Investors who are overly confident in their abilities may take on too much risk, leading to potential losses. They may also ignore warning signs and fail to adequately diversify their portfolios, putting them at greater risk of significant failures.
Finally, the herd mentality, an individual’s tendency to follow a larger group’s actions, can also drive market movements. This can lead to market bubbles and crashes as investors collectively rush to buy or sell.
Understanding these emotions and how they influence investment decisions is crucial for anyone in the stock market. By recognizing and managing these emotions, investors can make more rational and successful investment decisions.
How can this data be used for trading
The stock market psychology chart data can be a valuable tool for trading. Here’s how you can use it:
1. Identifying Market Sentiment: The chart can help you understand the overall mood of investors in the market. If the market is in the ‘fear’ zone, investors are pessimistic about the future and are selling their stocks. This could potentially be an excellent time to buy stocks at a lower price. Conversely, if the market is in the ‘greed’ zone, it suggests that investors are optimistic and buying stocks, which could inflate prices and might be a good time to sell.
2. Risk Management: By understanding the market sentiment, you can manage your risk better. For instance, if the market is in the ‘fear’ zone, you might want to be more conservative with your investments. On the other hand, if the market is in the ‘greed’ zone, you might want to take on more risk and invest more aggressively.
3. Long-term Strategy: The chart can help you stick to your long-term investment goals. Instead of reacting to short-term market fluctuations, you can use the chart to understand the broader market trends and make investment decisions accordingly.
By seeing market patterns and anticipated market reversals, investors may use the stock market psychology chart to control their emotions. Investors may want to consider selling their stocks and transferring their money into safer assets while the market is in the fear zone. They may also want to consider taking on more risk and buying stocks when the market is in the greed area.
Investors should also avoid making emotional decisions based on short-term market movements. Instead, they should focus on long-term investment goals and stick to their strategy.
Can these charts be helpful in trading?
Investors who understand the emotions that drive market movements can avoid making emotional decisions based on short-term market movements. Instead, they can stick to their long-term investment goals and avoid buying at the top of the market and selling at the bottom. This is because they are better equipped to recognise when emotions drive the market and when it is best to stay the course.
Moreover, these charts are not just useful for investors but also traders. By providing valuable insights into market sentiment, these charts can help traders identify potential market turning points, such as market tops or bottoms. With technical analysis and other indicators, traders can develop a more informed and well-rounded trading strategy.
It’s crucial to remember that no trading method is infallible and that market circumstances might change suddenly. Therefore, exercising caution and practising risk management is always wise when trading. Moreover, using these charts with other research and analysis is essential to make informed investment decisions.
It can be an invaluable tool for investors and traders. It enables them to manage emotions, identify trends and potential reversals, and make better investment decisions. Nonetheless, it’s essential to use these charts in conjunction with other analyses and exercise caution when trading.
How Can a Stock Market Psychology Chart Assist in Identifying Market Reversals?
Here is an example of how a stock market psychology chart could help identify a potential market reversal:
Let’s say the chart shows that investor sentiments have reached extreme greed – the market is well above its long-term average level, and valuations appear stretched based on traditional metrics.
At the same time, some technical indicators on the chart, like put/call ratios and volatility indexes, are flashing signs of overconfidence, with low put volumes and complacency. This signals most investors are dismissive of downside risk.
Surveys also show high levels of bullishness and predictions of further market gains without mention of credible threats. This is a sign that the hope of continued momentum has overwhelmed fear.
Looking at this profile, an informed investor using the psychology chart would see a classic picture of peaking optimism. Even without signs of deterioration, they know a pullback is likely as emotions mean-revert.
The divergences between fundamentals and sentiment provide an early warning of vulnerability. By promptly lightening exposures into overbought conditions, traders can mitigate portfolio risk ahead of an inevitable sentiment shift, whether driven by news or natural profit-taking.
It is capturing signs of extreme greed aids in avoiding full-blown tops defined only in hindsight. This illustrates one potent use of monitoring evolving emotions via the chart.
Nonetheless, at Tactical Investor, we maintain simplicity in our approach. We utilize our proprietary tools, such as the Anxiety Index, Stupidity Index, and Bull and Bear Sentiment Index. We aim to handle the complex analysis and provide clear signals for when the opportune moment to buy or sell is.
Sources for Stock Market Psychology Charts
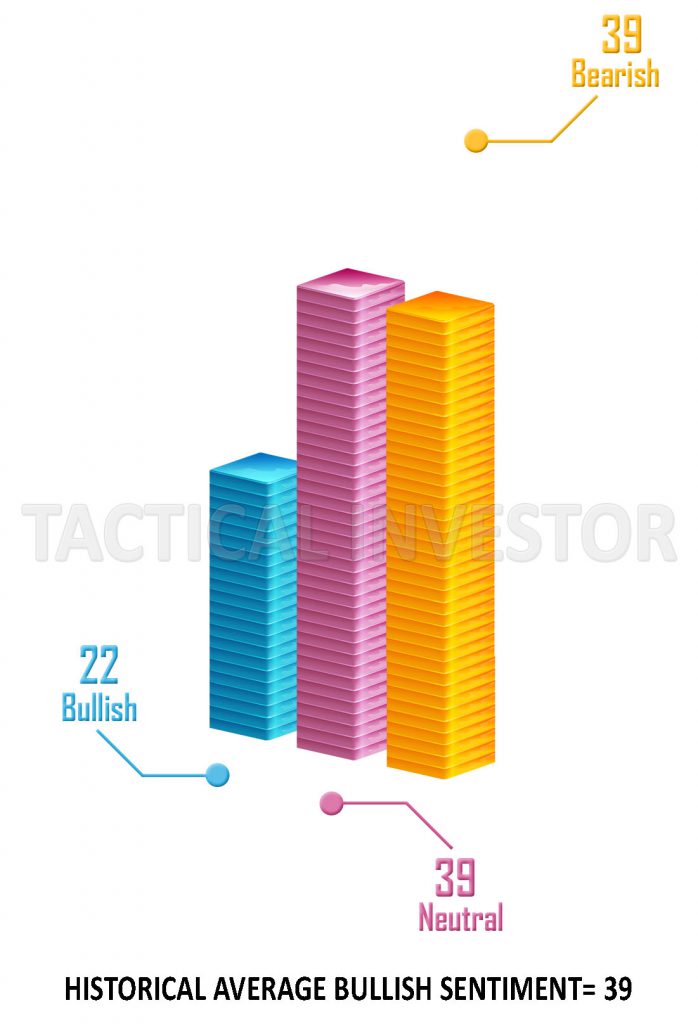
You’ve come to the right place if you seek charts of this nature. We offer regular updates you can receive by subscribing to our complimentary newsletter. The benefits of these charts are undeniable, particularly during spikes of sentiment. For instance, a market top is imminent if bullish sentiment remains above 60 for a prolonged period. Likewise, when bearish sentiment is hovering around 60, a market bottom is likely at hand.
However, the most exciting development is when neutral sentiment soars past 55. This trend suggests a long-term market bottom is approaching, and the bull market will last for an extended period. This is because nervous investors often take time to embrace a new bull market. When neutral sentiment reaches such heights, it indicates significant agitation among investors that can last for years.
Our Anxiety Index is proprietary, and its moves to extreme levels indicate an impending bullish or bearish trend. Combining this data with technical analysis and mass psychology can yield powerful results. As of May 3, 2023, we have posted the most recent charts below:
Conclusion
Understanding the emotions that drive market movements is critical to successful investing. The stock market psychology chart provides a valuable tool for investors to manage their emotions and make informed investment decisions.
By studying the stock market psychology chart, investors may avoid making irrational judgments based on transient market fluctuations. They can stick to their long-term investment goals and avoid buying at the top of the market and selling at the bottom.
In summary, the stock market psychology chart is an essential tool for investors who want to succeed in the stock market. By understanding the emotions that drive market movements and using the chart to manage their feelings, investors can make informed investment decisions and achieve their long-term investment goals.
FAQs
| FAQs | Answers |
|---|---|
| Is the stock market psychology chart accurate? | These charts are based on historical data and can provide valuable insights into market movements. However, it is not a perfect predictor of future market movements. |
| Can the stock market psychology chart be used for day trading? | The stock market psychology chart can be used for day trading, but it is more effective as a tool for long-term investing. |
| Where can I find a stock market psychology chart? | You can find a stock market psychology chart online or in financial publications. |
| How often should I check the psychology charts? | Investors should check the stock market psychology chart regularly, but not obsessively. Checking it too often can lead to emotional decision-making. |
| Can the stock market psychology chart be used for other investments besides stocks? | The charts can be applied to other investments besides stocks, such as bonds, commodities, and currencies. |
| Can the stock market psychology chart predict market crashes? | These charts can provide insights into potential market reversals but cannot predict market crashes with certainty. |
Discover More: Stimulating Articles That Will Captivate You

Stock Market Psychology Pdf: Mastering the Facts, Not the PDF

Cracking Market Cycle Psychology: Navigating the Ups and Downs

Best Silver ETFs: Shining Bright in Your Investment Portfolio

Harnessing the Psychology of a Market Cycle: Thrive in Bull and Bear Markets

ETF Definition: A beginner’s guide to exchange-traded funds

What is a Bull Market Simple Definition: Understanding the Basics of a Thriving Market

Why is investing in a mutual fund less risky than investing in a particular company’s stock?

Breaking Free: Embracing Early Extreme Retirement

What is a Bull Market? Unleashing its Power

Elliot Wave Theory: Navigating the Pitfalls

AI Takeover Theory: Humanity’s Crossroads with AI’s Future Impact

Financial Freedom vs Financial Independence: Your Wake-Up Call to Take Control

Embracing Contrarian Wisdom: How to Start Investing for Your Child

The Psychology of a Market Cycle: Navigating Emotional Turbulence