Blood In The Streets: That’s The Best Time To Buy
Nov 29, 2024
Introduction:
Polarisation has become the new VIX for the market, shifting the focus from economic news to geopolitical developments. Since Trump’s election, the masses and markets have been diverted towards less impactful issues, paving the way for corporate-friendly legislation with minimal resistance. This shift has insulated corporations from legal scrutiny and set the stage for stock prices to soar. While some may view a market downturn as a signal to exit, history and market psychology suggest intense fear and uncertainty often present the best buying opportunities.
The Benefits of Using Mass Psychology in Market Investing
Mass psychology is critical in financial markets, often driving irrational behaviour that astute investors can exploit. By understanding the emotional states of the masses, investors can make more informed decisions, especially during periods of panic. When fear grips the market, it often leads to the undervaluation of assets, creating lucrative opportunities for those who remain calm and objective.
The 2008 financial crisis saw widespread panic, with many investors selling off their assets at a loss. However, those who understood the principles of mass psychology and recognized the crowd’s irrational behaviour could buy undervalued stocks at a significant discount. Legendary investor Warren Buffett famously said, “Be fearful when others are greedy and greedy when others are fearful,” encapsulating the essence of contrarian investing during market panic.
Charlie Munger, Warren Buffett’s longtime business partner, has often emphasized the importance of psychological factors in investing. Munger advocates using “psychological models” to understand and predict market behaviour. He argues that investors can better navigate market turmoils and identify buying opportunities when others are selling in fear by recognising common psychological biases, such as herd mentality and overreaction to the news.
Ask a madman how he is, and he might respond by telling you that “ the road needs to be fixed”. The answer has nothing to do with your question and, on the surface, has no pattern whatsoever, but if you turned around and looked at the road, you might notice that it needs repairs. All you had to do was alter the angle of observance, and in doing so, you spotted something that most would have missed.
Don’t Listen To Experts: Buy When There’s Blood On The Streets
What if you asked him another question instead of declaring him insane, for example, “ Are you hungry?”. To which he responds, “ I hurt my toe yesterday”. You learnt something from the first question, so instead of trying to figure out the answer, you decide to look down, and you notice he is not wearing a shoe on the right foot, and the toe is wrapped up in a bandage.
What is the pattern here? The guy is not responding to your inquiries; maybe he is not as insane as he appears or thinks your questions are silly. The second thing to conclude is that he is more concerned with reality than possibility. Thus, the information is not useless; it appears ineffective because most would be ready to evaluate this person based on what they deem sane or insane. In other words, they would follow SOP (standard operating procedure).
Markets March to their Drumbeat and not to yours
This is what is going on in the markets today. If you ask the market a question based on what worked in yesteryear, then the answer will sound insane. However, the answer is not insane. The person asking the same question over and over again and expecting a new outcome is the one who is insane. The markets spoke years ago and continued to talk, but no one listened; experts kept asking the same question.
Markets march to their drumbeat, not yours. The logical way to examine this market is to stop looking at what it should be doing and instead focus on what it’s doing and why it’s doing this. The markets are erratic because people today act as if they are insane. Everyone has an emotional stake in every possible outcome. A market is nothing but a seething cauldron of emotions. The crowd is insane, so expect nothing different from the market.
Blood on the Streets Moment Approaching in 2018?

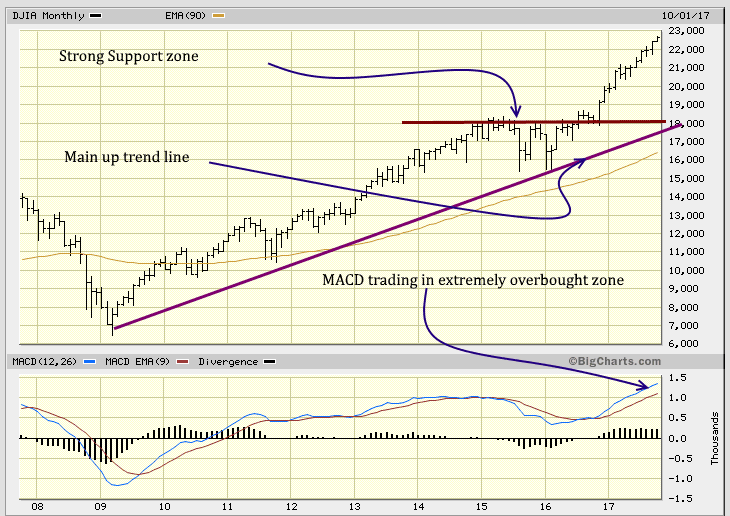
The chart speaks for itself; the markets are trading in highly overbought ranges. Traders should be cautious when committing too much money to this market. Open positions in oversold stocks or stocks that have taken a beating but whose future appears to be turning around. Make sure you have stops in place. Markets can trade in the overbought ranges for months on end. Each bar in the above chart represents a month’s worth of data, and you can see that this phenomenon that we just mentioned occurred from Oct 2012 until Aug 2015. A strong pullback is possible, but Stock Market Crash 2018 is a low-probability event.
Game Plan. Whenever There’s Blood on The Streets Buy
The stock market has been trending in the overbought ranges for an extended period, so what’s the plan? In such situations, you have only two options. We have already implemented the first option: forget what the markets are doing, focus on the trend, and wait for the indicators to move to the oversold ranges.
What happens if our proprietary technical indicators refuse to pull back? Option 2 comes into play: focus on stocks trading in the extremely oversold ranges; the emphasis should be on the monthly charts. Most new plays we issue are trading in the oversold ranges on the monthly charts. In such a mature bull market, it’s challenging to spot stocks trading in the oversold range on the monthly chart. Sometimes, we must go through 200 stocks to find one possible candidate, and sometimes we find nothing.
If the indicators move into the oversold range and the markets don’t pull back strongly, then the follow-through reaction (upward move) will be very strong. Market Update Sept 1, 2017
In such conditions, we suggest you buy some stocks but focus on those trading in the oversold to extremely oversold zones. Build up cash so that when the market pulls back, you have the capital to deploy into top stocks selling at a discount.
Masses will throw the baby out with the bathwater.
We are almost positive that the masses will panic extremely fast during the next pullback, and in doing so, they will throw the baby out with the bathwater. Instead of the Dow pulling back 1500 points, it will probably shed double that amount before a bottom takes hold.
But oh my, what a great buying opportunity this will prove to be, provided the trend is up. There is no indication that it will change even if the Dow sheds 3000 points. If the Market crashes in 2018, it will be another splendid buying opportunity. Until the masses embrace this market, the bull will continue to charge higher.
Fine-Tuning Investments with Technical Analysis
Technical analysis provides a framework to supplement mass psychology insights, offering specific indicators to identify optimal entry and exit points. By analyzing patterns and trends in stock prices, investors can fine-tune their strategies to maximize returns. Indicators such as moving averages, relative strength index (RSI), and Bollinger Bands help determine market sentiment and potential reversals.
During the COVID-19 pandemic, the market experienced extreme volatility. Technical analysis tools like the RSI and moving averages helped investors identify oversold conditions, signalling potential buying opportunities. For instance, when the RSI dropped below 30, it indicated that stocks were oversold, prompting savvy investors to buy at lower prices before the market rebounded.
Combining with Mass Psychology: Technical analysis with an understanding of mass psychology can be particularly powerful. For example, mass psychology might indicate widespread fear and panic during a market downturn. Technical indicators, such as moving averages crossing from below, can confirm that the market is bottoming out, providing a clear signal to invest. Using both approaches, investors can make more informed decisions and potentially achieve better returns.
Tactical Investor Update Aug 2019
Experts are notorious for issuing dates and dire predictions, but on both counts, if one bothers to track their performance, one will find that monkeys with darts fare much better.
We stated this to our subscribers on the 11th of July 2019.
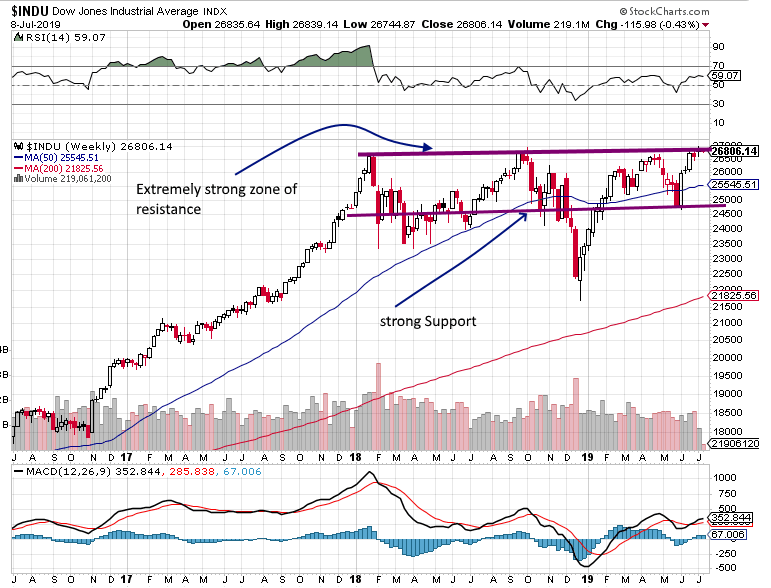
Looking at the chart below, it would be easy to conclude that we are about to push the “triple top” theory, but we are not. We are looking at the picture in terms of extreme resistance and extreme support zones. The Dow has tried to trade above the 26,800-27,000 range for almost 19 months. Furthermore, these attacks have been widely spaced out. Hence, the Dow is now at an inflexion point”; it either blasts above 27,000 and, in doing so, former resistance turns into strong support.

When their wish comes true, the masses complain about better prices. They panic and flee to the hills, which they call investing. They oscillate between misery and euphoria and have a dangerously short lifespan. The crowd is too scared and nervous to support a stock market crash outlook. If the market pulls back strongly and there is blood in the streets, then the astute investor should back the truck up and load it with quality stocks.
Blood on the Streets: Strike While They Panic
Fear is the market’s gift to the fearless. When chaos reigns, and the herd flees, the savvy investor scoops up quality assets at absurd discounts. Crashes aren’t catastrophes—they’re clearance sales for the bold.
The crowd always gets it wrong. They panic at bottoms and cheer at peaks, buying high and selling low. Your job? Do the opposite. Ignore the noise, watch the trend, and when the streets run red, back up the truck and load it with undervalued stocks.
Markets don’t crash—they cleanse. Every panic hides a goldmine for those with steel nerves. Remember: fortune doesn’t favour the fainthearted. It rewards those ready to act when everyone else is paralyzed by fear.
Enrich Your Knowledge: Articles Worth Checking Out
Embracing Facial Recognition Technologies: The Future of Payments!


