
Editor: Vladimir Bajic | Tactical Investor
Stock Market Crash 2008 chart vs 2020: Learn from History
Oct 17, 2024
Introduction: How the Masses Misread Market Chaos
What if you saw an opportunity every time the masses ran in fear? In investing, the crowd behaves like a flock of lemmings, racing to the cliff’s edge when markets plummet and scrambling to buy when prices soar. This herd mentality is a major reason the majority lose, buying high and selling low. Yet, history shows us that the most profitable moments arise during these chaotic times. Those who act against the masses, buying during panic and selling into euphoria, are the ones who stand to gain the most.
Take the 2008 stock market crash, for example. At the height of panic, many fled the market, convinced it was the end of capitalism as we knew it. Yet, if you had jumped in toward the end of 2008 or early 2009 and held your ground, you would likely be sitting on considerable wealth today. The same pattern repeated during the COVID-19 pandemic—what seemed like the beginning of a prolonged economic downturn turned into an incredible buying opportunity. The chart below clearly illustrates this point.
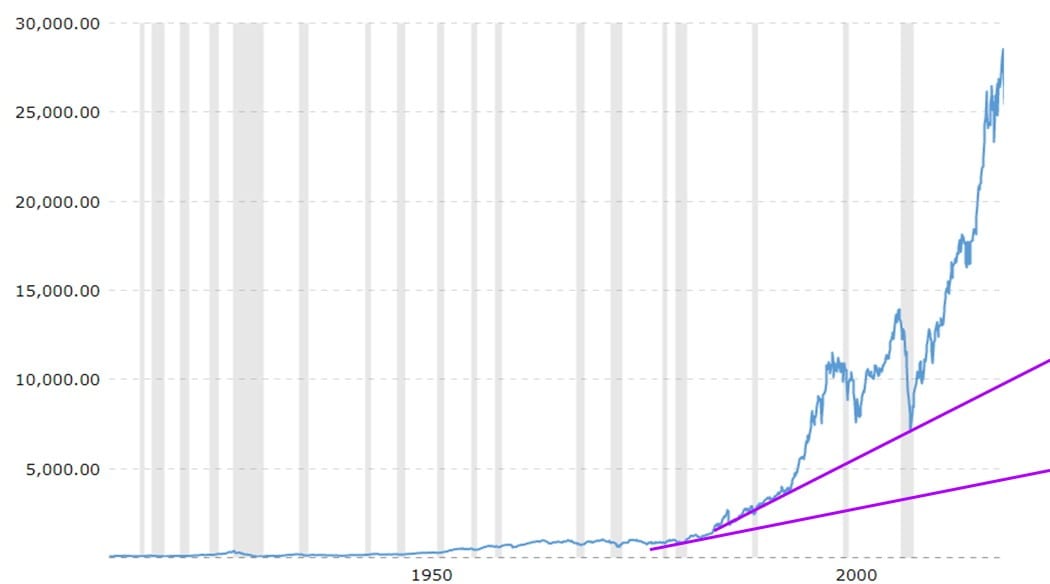
Source: macrotrends
What does this chart tell us? It reveals the truth that a massive bull run follows every market crash. And those who have the patience and insight to see beyond the panic are the ones who profit handsomely. The masses, driven by fear and anxiety, miss these golden moments and instead sell at the bottom and buy at the top—a pattern that has persisted for centuries and shows no signs of changing anytime soon.
The Truth Behind 2008: A New Dawn, Not the End
Looking back at the 2008 financial crisis, it’s easy to focus on the devastation—the failure of Lehman Brothers, the collapse of the housing market, and the global recession that followed. But this event was more than just a financial disaster; it was a once-in-a-generation buying opportunity. As analysts from JP Morgan noted, had you invested at the market’s bottom in 2009, your returns over the next decade would have dwarfed those made during the more “stable” times.
The similarities between 2008 and today’s markets are striking. At both times, fear gripped investors, forcing them to liquidate holdings at rock-bottom prices. However, astute investors—those who understand that markets overreact to bad news—seized the moment. By purchasing quality stocks at a discount, they capitalized on one of the greatest bull markets in history.
The 2016 Crash Fears: Another Case of Herd Mentality
Fast forward to 2016, when analysts and media pundits were again sounding the alarm bells. They claimed that a new market crash was imminent. But just like in 2008, these fears were largely overblown. The markets continued rising, and those who followed the panic missed substantial gains.
When the media and so-called experts start pushing the narrative of a market crash, it’s crucial to remember one thing: their goal is not to provide you with actionable advice. Instead, they thrive on stirring fear because fear sells. But savvy investors ignore the noise and focus on the bigger picture. As famed investor Warren Buffett said, “Be fearful when others are greedy and greedy when others are fearful.” In 2016, those who adhered to this principle profited, while those who succumbed to fear were left empty-handed.
Mass Psychology: The Art of Contrarian Investing
At the heart of successful investing is understanding mass psychology. The crowd, driven by emotions rather than logic, tends to make irrational decisions. This is evident every time there’s a market downturn. The masses act like frightened burros, running blindly in fear when they should be calmly strategizing.
Market crashes are a perfect illustration of this behaviour. When prices plummet, most investors panic and sell off their assets. However, some contrarian investors see these dips as buying opportunities. They understand that markets are cyclical and that a recovery follows every crash. In fact, the most successful investors, like Ray Dalio and Carl Icahn, have built their fortunes by doing the opposite of what the masses do.
Take the 2017 Bitcoin crash, for instance. While many panicked and sold their holdings, a handful of contrarian investors doubled down. Their foresight paid off when Bitcoin rallied to all-time highs in the following years.
The chart above illustrates a fundamental truth: markets trend upward over the long term. The key to success is tuning out the noise and staying focused on the bigger picture. Those who master this skill will find themselves well-positioned to profit from future downturns.
Examples of Buying Opportunities During Crashes
Let’s examine a few notable examples of market crashes that turned into buying opportunities:
1. The Dot-Com Bubble (2000): When the dot-com bubble burst in 2000, the NASDAQ dropped nearly 80%. Investors who fled the market missed out on the incredible tech boom that followed. Companies like Amazon and Apple, trading at a fraction of their current value, became giants in the years that followed. Those who bought into tech during the crash made astronomical returns.
2. The COVID-19 Pandemic (2020): The initial panic surrounding the COVID-19 pandemic caused a sharp market decline in March 2020. However, the subsequent recovery was one of the fastest in history. Investors who bought in during the dip, particularly in sectors like tech and healthcare, saw their portfolios surge in value as the market rebounded.
3. The 1987 Black Monday Crash: In October 1987, the stock market crashed by over 22% in a single day, the largest one-day percentage drop in history. However, this, too, was followed by a strong recovery. Investors who bought during the crash saw significant gains as the market rebounded over the next few years.
Each of these examples highlights a critical point: **market crashes are temporary**, but the opportunities they present can be life-changing. The masses, however, consistently fail to recognize this and instead sell out of fear, only to miss out on the subsequent gains.
The RSI Divergence: A Hidden Signal for Market Reversals
Another powerful tool for identifying opportunities in a market downturn is the **RSI (Relative Strength Index) divergence**. This indicator measures the speed and change of price movements and can help spot trend reversals.
For instance 2008, as the market crashed, savvy investors paying attention to RSI divergence saw early signs of a reversal. As the market continued to fall, the RSI indicated oversold conditions. Those who recognized this divergence could buy in just before the market recovered.
The chart above shows how RSI divergence signalled a potential bottom during the 2008 financial crisis. The market was falling, but the RSI was moving upward, indicating that the selling momentum was slowing. This was a key signal for contrarian investors to buy, even as the masses panicked.

Conclusion: Stock market crash 2008 chart vs 2020
In the world of investing, the masses are often wrong. They act like lemmings, running toward disaster when they should stay calm. The market crashes of 2008, 2016, and 2020 are stark reminders of this. Those who ignored the noise and followed the indicators—like RSI divergence—could capitalize on the panic and make substantial gains.
The truth is simple: market crashes are opportunities in disguise. They provide the perfect moment to buy quality stocks at a discount. But only those who can remain calm and act contrary to the herd can seize these opportunities. So, the next time the market crashes and the masses run for the exits, stay calm, stay focused, and buy when others are selling. That’s how real wealth is built.
In the end, markets always recover, and those who are patient will be richly rewarded.