
Patience is power; with time and patience, the mulberry leaf becomes a silk gown.
Chinese Proverbs, Sayings of Chinese Origin
Unraveling the History of Stock Market Crashes: When Fear Prevails
Updated September 30, 2023
We will delve into this topic in a historical context for two reasons. First, those who neglect to draw lessons from history are destined to relive its patterns. Second, our position in this article aligns with our actions during the referenced period. We not only discuss but also implement our strategies.
While the data may appear old-fashioned, the essential lesson to glean is that history unfailingly echoes itself. In financial markets, old patterns persist, and only those with a discerning eye recognize the folly of adhering to the same rhythm while anticipating disparate outcomes. The principles of Mass Psychology posit that optimal opportunities arise when the masses succumb to panic, and conversely, prudent exits occur amidst their euphoria.
By amalgamating Mass Psychology with elementary yet astute observations, a selection of which is delineated below, one cultivates a distinctly favourable prospect of prospering within the financial markets. Seasoned observers of market dynamics concur that a meticulous examination of the annals chronicling stock market crashes unequivocally demonstrates that prudent investments in top-tier enterprises during these tumultuous phases would have resulted in substantial fortunes.
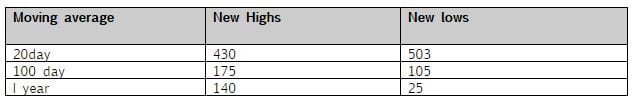
Here are the statistics:
– The 20-day moving average of new lows is 4615, setting a new record on September 16th, 2008.
– The one-year moving average of new highs is 10, establishing a new all-time low on November 25th, 2008.
– The one-year moving average of new lows is 2225, marking a new record on September 16th, 2008.
The count of new highs has experienced a slight increase.
However, the 20-day moving average of new lows continues to maintain its lead despite a persistent market rally over the past two days. Another significant observation is that the new lows’ 100-day and one-year moving averages have shown minimal change compared to last week’s figures. This pattern unequivocally signifies that the market’s internal framework displays signs of weakness, suggesting that not all is well within the financial markets.
In one week the Dow was able to take out 10400, and 10200 and the interesting part is that both price points were taken out on a volume of over 7 billion shares. If the Dow remains below 10,200 today, it will have traded below 10,200 for three days and will now issue a stronger signal that it is ready to mount a decent to steep correction. The break below 10,200 is significant, for it was the bottom of a channel formation that took shape in Nov 2009. A break below a channel formation, especially when the markets are extremely overbought, usually produces a strong move in the downward direction. Market update Jan 26, 2010.
Mastering Emotional Control for Successful Stock Market Investing
Emotions often influence investment decisions and can lead to impulsive and irrational actions. Exercising emotional control and avoiding hasty choices is crucial in minimising the risk of losing money in the stock market. Discipline, adopting a long-term perspective, and staying focused on investment goals are essential in managing emotions effectively.
While some financial loss is inevitable in the stock market, embracing a contrarian approach to investing can help minimise these losses. By maintaining discipline, diversifying portfolios, staying well-informed, and avoiding impulsive decisions, investors can potentially mitigate the risk of losing money. It is vital to remember that investing is a long-term endeavour that requires patience and emotional control to achieve desired investment goals. By adhering to these principles, investors can strive for higher returns and reduce the risk of financial losses in the stock market.
Analyzing Trends: Key Support and Resistance Points as Determinants
The Dow saw a low point at 10,050, while Dow futures dropped 9,994 before staging a robust rebound. The breach below the 10,200 level shifted the trend to a negative one, but the Dow must maintain its position below this threshold. Crucial price levels inherently define trends, and to uphold a trend’s validity, the market must consistently stay below that particular price point. Therefore, if the Dow trades above 10,200 for three consecutive days, it will nullify the previous signal.
However, it’s worth noting that breaching a channel formation after a solid upward surge typically results in a significant downward movement. Even if this happens, it will only postpone the action rather than negate it. There are further indications that not everything is smooth in the markets. For instance, MMM, a stock that surged alongside the Dow, closed lower on Monday and remained unchanged today. Despite the Dow’s recent gain of over 200 points in the past two days, several former high-performing stocks in the banking sector are also exhibiting lacklustre performance.
Distinguishing Between a Correction and a Crash
The Dow’s rapid descent from 10,729 to 10,000 was marked by an exceptionally intense pullback, which hadn’t been witnessed since March of the previous year. Consequently, this abrupt pullback has led many market participants to revert to the conventional buying strategy when prices dip. Additionally, a sizable group of traders who remained on the sidelines for an extended period might perceive this substantial but swift pullback as an enticing buying opportunity. However, it’s essential to recognize that this situation resembles more of a trap than a genuine buying opportunity.
The most prudent stance is to remain on the sidelines until a compelling sell signal emerges or another buy signal materializes. To sufficiently release the market’s pressure and shift the risk-to-reward ratio in our favour, the Dow would need to shed a minimum of 1,500 to 1,800 points, whereas it has only shed around 700 points thus far.
Stock Market Crashes Low Volume as an Ominous Sign
Despite the robust two-day rally in the Dow, the volume has not yet reached the 6 billion mark. On Monday, it barely reached 4.7 billion shares, and today it stood at 5.47 billion. In contrast, on the 21st and 22nd of January, when the market experienced a sell-off, the volume surged on both days, surpassing the 7 billion mark. This single factor is a critical reminder of the precarious nature of the current market structure.
Notably, during just a few months, the Dow achieved a remarkable 22 new highs, a substantial figure. However, not once did the volume climb to 6.8 billion, let alone 7 billion shares, during these highs. Conversely, when the market experienced a sell-off, the volume surged to over 7 billion shares for two consecutive days. This development carries significant importance, signifying a fragile long-term market outlook.
Subscribers should recall the swift drop from 10,729 to 10,050 in the Dow as a prelude to future developments. If the market surges to retest previous highs or establish new ones, it’s essential not to be deceived by the upward movement. Paying close attention to volume and any divergences is paramount.
Exciting read: Economy: Exploring Different Economic Systems
Stock Market Crashes: Dow Utilities Breaking Down, an Early Warning
The Dow utilities exhibited a breakdown a month before the broader markets, suggesting a possible resurgence in their leadership role. If the Dow were to rally to new highs while utilities fail to achieve the same feat or advance of the Dow, it would be a clear warning signal that the markets are entering a precarious zone.
Furthermore, copper, another key economic indicator, trades significantly below its previous highs, and the Baltic Dry index has formed a double-top pattern. These factors indicate potential financial challenges.
Should the Dow rally to test its previous highs without experiencing a pullback to the 9,200-9,400 range, it would be setting the stage for a severe correction. The recent swift downward movement was insufficient to release the pent-up pressure in the market, and a strong rally now could result in a situation akin to the one observed in the bond markets between December 2008 and July 2009. During that period, bonds saw a massive 20% decline in just six months. In the context of stocks, a comparable move would equate to a drop of 40% or more.
Volatility Levels Are Surging
Volatility readings have again surged to new highs, indicating that significant market fluctuations will likely persist. It’s noteworthy how rapidly the market pulled back and reversed course just as swiftly. While most of these moves have primarily been in an upward direction, it appears that the next phase will involve a majority of swings on the downside.
In conclusion, we will promptly issue an interim update if the current daily sell signal is nullified and a buy signal emerges on the daily charts. This could potentially serve as an early indication that the Dow is preparing to retest its previous highs. We still have an active daily sell signal, while the weekly signal, though approaching the sell zone, has not yet generated a sell signal.
If you focus solely on the very short-term perspective, you may become frustrated with the need for patience and discipline. However, it’s essential to realize that a more comprehensive assessment is required before diving in. Substantial gains are not typically achieved by adopting an extremely short-term view.
For several consecutive months, we emphasized that Palladium presented an outstanding buying opportunity (sometimes even referring to it as a compelling buy). From October 2008 to March 2009, though, it exhibited minimal movement. Short-term traders might have found this discussion unexciting, but those who exercised patience and held their positions ultimately reaped significant rewards.
The History of Stock Market Crashes and Investing
A similar principle applies to the stock markets. We discussed the possibility of the markets reaching a bottom long before the actual bottom materialized. In February 2009, when we set a target of Dow 10,500, the market faced significant challenges, and our outlook might have appeared overly optimistic. We faced this scenario repeatedly, and we found that the same fundamental principle held each time. Those who lacked patience or discipline often surrendered their gains and then some.
When examining the history of stock market crashes, a recurring theme emerges: the best time to buy is when the masses are gripped by panic. While experts may present a different narrative regarding the stock market crash history, it’s essential to note that those who consistently adopted a bearish stance would have ultimately depleted their fortunes. This underscores the fact that, over time, markets tend to trend upward.
Avoid joining this group, as they are constantly seeking new members.
The daily trend remains bearish, and all long-term indicators indicate that the risk-to-reward ratio does not favour opening long positions. Only very short-term indicators show some bullish signals, which tend to change direction rapidly. We recently witnessed how swiftly the markets can decline when selling pressure intensifies. Despite the Dow’s attempts to reach the 10,700 range since November 2009, it plummeted from 10,700 to its November 2009 levels in just a few days, erasing months of gains within a short span.
Market internals and volume are also signalling potential issues ahead. Therefore, despite the temptation to enter the markets, we strongly advise long-term investors to remain on the sidelines and perhaps cautiously consider acquiring put positions as a hedge. Once a full-fledged or strong sell signal emerges, a more aggressive approach to purchasing puts can be regarded as.
Analyzing the History of Stock Market Crashes: Quantifying Signals
A complete sell signal refers to a signal generated by our intelligent money indicator, while a powerful sell signal would originate from the weekly timeframes. We only have an active daily sell signal, so we do not plan to take aggressive action based solely on this signal.
Looking further ahead, spanning 7 to 12 months into the future, we anticipate numerous opportunities in the commodities sector. This expectation arises from the ongoing actions of central governments, which are likely to continue devaluing their currencies. Moreover, supplies of various essential commodities are dwindling across the board. Precious metals are expected to shine brightly over the long term as central bankers continue to create new money at an astonishing rate. Additionally, many countries may need to curtail their mining operations due to electricity shortages, adding another dimension to the equation when the situation stabilizes.
Nonetheless, it’s crucial to remember our previous advice: the history of stock market crashes suggests that wise investors should be inclined to buy when fear prevails and sell when the noise becomes overwhelming.
Are Commodities Primed for a Robust Rally?
Numerous compelling factors support a robust and sustained rally in the commodities sector, particularly within the Energy and Precious Metals sub-sectors. The scope of these reasons is extensive and could warrant an entire article to cover comprehensively. However, there is scant evidence to back a long-term rally regarding the broader financial markets. Finding solid support for an extended market uptrend would require considerable imagination, though circumstances may change in the future. The saying “don’t fight the feds” holds significance; if the Federal Reserve maintains its aggressive stance, the market could rally significantly higher, even without strong fundamental and technical support.
We anticipate further upside in Gold, but we note early indications of strength in the dollar based on our indicators. This suggests Gold may establish a multi-year peak before resuming its upward trajectory. Additionally, the dollar seems poised for a substantial rally, and the Dow could follow suit if the Fed continues its assertive approach. Injecting liquidity into the market is a swift method to bolster market performance. Therefore, it’s advisable to exercise patience, as many sectors that have rallied since March 2009 may be fundamentally vulnerable and could falter when confronted with reality.
An ounce of patience is worth a pound of brains.
Dutch Proverbs, Sayings of Dutch Origin
Originally published in February 2010, this piece has undergone multiple updates over the years, with the most recent revision completed in September 2023.
Compelling Piece Worth Delving Into

Mob Mentality Psychology: Understanding and Profiting

IBM Stock Price Prediction: Time to Buy or Fly?

Examples of Herd Mentality: Lessons for Learning and Earning

When is the Next Stock Market Crash Prediction: Does it Matter?

Inductive vs Deductive Analysis: The Clash of Perspectives

Investor Sentiment Index Data: Your Path to Market Success

Unraveling Market Psychology: Impact on Trading Decisions

Is Value Investing Dead? Shifting Perspectives for Profit

What Will Happen When the Stock Market Crashes: Time to Buy

Dogs of the Dow 2024: Barking or Ready to Bite?

The Trap: Why Is Investing in Single Stocks a Bad Idea?

How Can Stress Kill You? Unraveling the Fatal Impact

Financial Mastery: Time in the Market Trumps Timing

Investment Pyramid: A Paradigm of Value or Risky Hail Mary?

Contrarian Investing: The Art of Defying the Masses
Common Trading Mistakes: Sidestepping Pitfalls to Maximize Profits
