Copper Market Trends: A Bullish Long-Term Outlook
Updated Jan 3, 2024
When updating articles, we post the current view at the beginning and provide historical perspectives afterwards as reference points, allowing readers to determine the accuracy of our predictions.
In contrast to the prevailing consensus, we at Tactical Investor believe that the dollar will likely put in a multi-year top in 2024 (it already gave initial signs of a top in 2023), paving the way for solid rallies in commodities such as copper and gold and potentially unleashing a wave of actual inflation in the United States. While some may attribute the recent record-high copper prices to issues with supply and inflation, we believe that it is primarily a result of misguided political decisions made by world leaders, with the United States policies being a prime example.
Despite a brief setback, copper has remained remarkably steady and has even surged beyond the 4.50 mark, challenging the notion that the global economy is in dire straits. However, this also means that the market will likely be range-bound for years, presenting a significant challenge for long-term investors primarily focusing on indices. Yet, this could give a rare and lucrative opportunity for traders willing to embrace contrarian views and utilize market psychology and technical analysis.
Copper Market Trends: Deciphering Long-Term Patterns and Bullish Cycles
This chart strongly supports and confirms our core perspective: that, when viewed through a long-term lens, market downturns actually present lucrative buying opportunities. Much like the Dow utilities, and possibly even more prominently, copper acts as a leading indicator for both upward and downward market movements. The enduring upward trajectory evident in this chart underscores copper’s resilience, indicating that as long as it maintains a level above 1.90, it stays within its established long-term trend. Until a significant deviation from this trend occurs, the strategy remains to “seize the opportunity during market crashes and dismiss the noise.
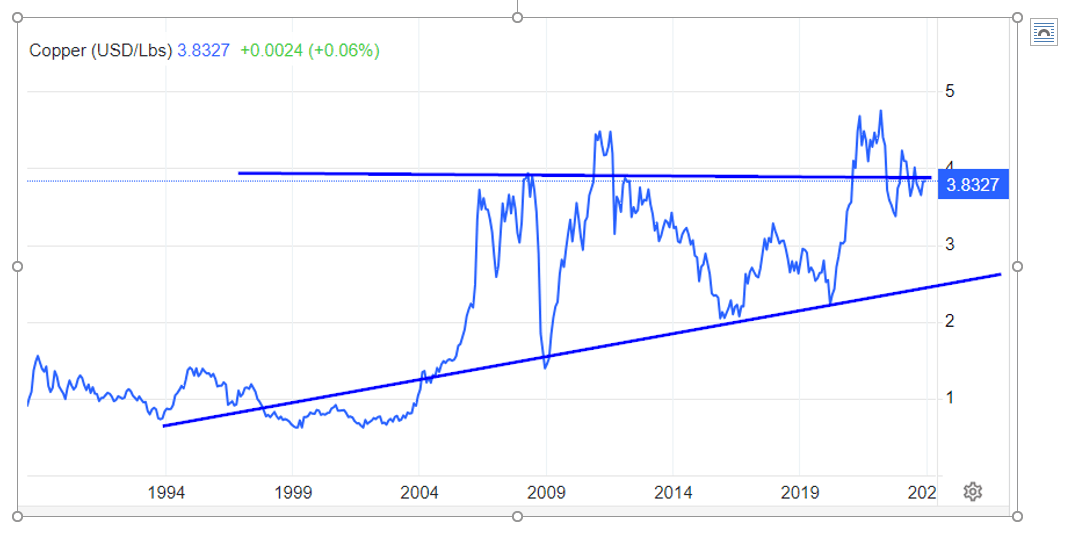
Shifting our attention to pivotal aspects, the inception of a new bull market typically occurs when surpassing previous highs and concludes when the price doubles from the breakout point. For copper since 2009, breakouts transpired in 2011, 2021, and 2022, but the price failed to double following each breakout—the breakout point hovering around the 3.80 to 3.90 range. To complete the next bullish cycle, copper must trade at approximately 7.60. A weekly close at or above 3.90 should indicate higher prices and a monthly close at 4.20 will trigger significant upward momentum, paving the way for a test of the 6.50 plus range.
Now to the Historical analysis
While the majority were panicking and becoming increasingly bearish with each passing day, we observed copper emitting an early warning signal of an impending shift.
Upon analyzing the copper charts, it appears that the economy and the copper market are trending in the same direction. Doctor Copper seems closer to a bottom than a top, suggesting that, from this perspective, we can infer that the market is also nearing a potential bottom, especially when considering the long-term view. Copper has a historical tendency to establish a bottom well ahead of the broader markets and the economy, providing an early warning signal of a possible change in market direction.
During the last strong correction, which lasted from 2000 until early 2003, copper put in a bottom towards the end of 2002, well before the markets and the general economy. Thus a change in direction here will provide the first signs of a turnaround. If the Dow trades down to the 7200 ranges and or puts in a new 52 week low, while copper starts to trend higher, it will be a very strong long-term bullish sign. Market Update Dec 23, 2008.

After trading as low as 120, copper has mounted a rather strong comeback in a matter of days. After breaking below the very important support zone of 140.50-142.00, it was able to remarkably trade above it with ease. Former strong support zones normally turn into very strong resistance points; its ability to break past it with such ease suggests that copper has or is very close to putting in a long-term bottom. Copper is one of the first markets to recover and thus a recovery here would be another positive sign for the equity markets. Market update 6th January 2009.
It is now giving the first signs of a long-term bottom formation, even though in the short-term, there is a possibility it could momentarily spike down to the 105-110 ranges. From a long-term perspective, the current pattern indicates a long-term bottom, and traders would be wise to start looking into the possibility of taking small bites in some of the key players in this sector. If for some reason, copper trades down to the 110 range, traders should view this as a long-term screaming buy. A close above 160 would significantly diminish the chances of copper trading down to the 110 range. Published on the 10th of January 2009.
The channel formation has moved from the 120-150 ranges to the 140-160 ranges, and even though copper has not yet managed to trade above 150 for 12 days in a row, the fact that the channel formation is moving higher is a bullish sign. As a result of the strength in the channel formation, copper now would need to trade above 150 for only 7-9 days to indicate that the next target is 180—2nd March 2009.
Copper traded past 150 for nine days in a row and, in the process, hit its first upside target of 180 before pulling back. The next objective for copper would be to trade past 180 for 3-5 days in a row and, in doing so, set up a pattern that would trigger a move up to the 220-240 ranges before a more substantial correction takes hold.
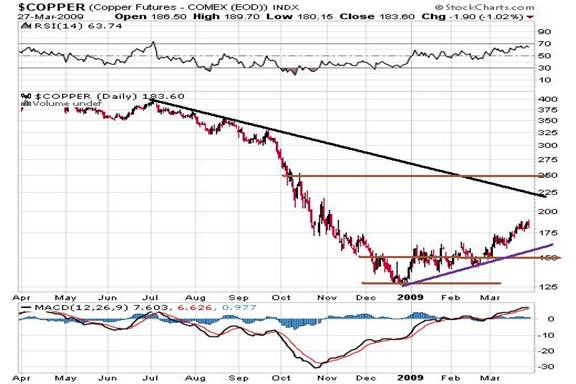
Copper’s Early Indicator Role – March 10, 2009 Update
The above chart indicates that copper will likely encounter significant resistance at or around 250. It will likely require several attempts before copper can successfully breach this resistance zone. However, once it surpasses this level, there appears to be virtually no resistance until around 300.
Copper has been maintaining its position well above its previous lows. A breakthrough beyond 180 would strongly confirm the potential for the Dow to rally for another two months before experiencing a correction. market update is from March 10, 2009.
Since copper often serves as an early indicator of the stock market’s performance and economic strength, its continued strength suggests that the needs have substantial upside potential. That copper traded and closed above 180 represents the first signal of potential further upside. The higher copper’s price climbs, the greater the overall strength of the market, and if copper can reach the 220-240 range, there is a strong possibility that the Dow could surpass 9000 before the subsequent correction begins.
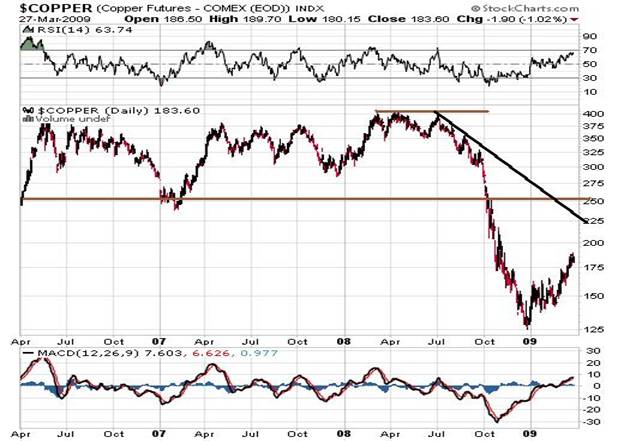
The chart spanning three years also affirms that the price level of 250 will present a significant hurdle in the future. In the short term, copper is expected to rally and test its primary downtrend line, which, on both the 1-year and 3-year charts, equates to a price range of 225-250.
Copper appears to have established a bottom that has lasted for several months, and it is poised to surpass its prior highs and establish a series of new highs that will last for decades. If copper prices should test their recent lows, traders should quickly purchase as much copper as possible. Copper equities have already risen considerably, and if copper achieves the suggested objectives, most equities should see gains of over 50
Copper Market Trends: Concluding Thoughts
Copper appears to have put in a multi-month bottom and is now on its way to testing the 225 range and possibly higher. If, by some miracle, it should trade down to the 140 range again, long-term traders should look at it as an early Christmas gift and load the truck up. There are many good plays in the copper sector; some of the small chaps will lock in higher gains on a percentage basis, but FCX is a good play for those seeking a blue chip stock that is also a Gold and Silver producer.
Taking a long-term perspective, copper is still a bargain; a day will come when its current all-time high will look cheap, so one can imagine how the majority will feel in the years to come when, instead of buying aggressively, they sit moping around waiting for the experts to guide them.
Success is a journey, not a destination. The doing is usually more important than the outcome. Not everyone can be Number 1. Arthur Ashe1943-1993, African-American Tennis Player
Other articles of interest:

Mob Mentality Psychology: Understanding and Profiting

IBM Stock Price Prediction: Time to Buy or Fly?

Examples of Herd Mentality: Lessons for Learning and Earning

When is the Next Stock Market Crash Prediction: Does it Matter?

Inductive vs Deductive Analysis: The Clash of Perspectives

Investor Sentiment Index Data: Your Path to Market Success

Unraveling Market Psychology: Impact on Trading Decisions

Is Value Investing Dead? Shifting Perspectives for Profit

What Will Happen When the Stock Market Crashes: Time to Buy

Dogs of the Dow 2024: Barking or Ready to Bite?

The Trap: Why Is Investing in Single Stocks a Bad Idea?

How Can Stress Kill You? Unraveling the Fatal Impact

Financial Mastery: Time in the Market Trumps Timing

Investment Pyramid: A Paradigm of Value or Risky Hail Mary?

Contrarian Investing: The Art of Defying the Masses
Copper Market News: Distilling Long-Term Patterns
Navigating Uncharted Waters: The Art of Contrarian Strategies
