
Introduction
May 26, 2023
The Price to Sales (P/S) ratio is a financial metric used by investors to assess the relative value of a company’s stock. It provides insights into the market’s perception of a company’s sales-generating potential and its ability to translate those sales into profits. In this guide, we will explore the Price to Sales ratio in detail, understand its calculation, and examine its significance in investment decisions.
Understanding Price to Sales Ratio
Definition and Calculation
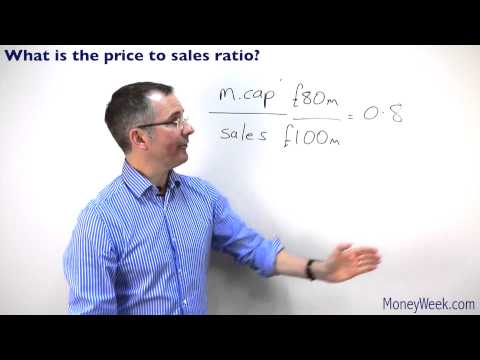
By dividing a company’s market capitalization by its total revenue, the price-to-sales ratio is calculated. It represents the amount investors are willing to pay for each dollar of a company’s sales. It represents the amount investors are willing to pay for each dollar of a company’s sales.
How to Interpret the Price-to-Sales Ratio
Interpreting the P/S ratio requires comparing it to historical values, industry benchmarks, and competitor ratios. A higher ratio may indicate an overvalued stock, while a lower ratio could suggest an undervalued opportunity.
Advantages of Using Price to Sales Ratio
Simplicity and Ease of Use
The P/S ratio is a straightforward metric that is easy to understand and calculate. It provides a quick snapshot of a company’s valuation without the complexities involved in other ratios.
Useful for Comparing Companies
The P/S ratio enables investors to compare companies within the same industry or sector, regardless of their profitability or earnings. It is particularly helpful when analyzing startups that may not have substantial earnings yet.
Valuing Startups with No Earnings
For startups or companies with negative earnings, the P/S ratio can be a valuable tool for valuation. It focuses on revenue generation potential rather than profitability.
Limitations of Price to Sales Ratio
Ignoring Profitability
The P/S ratio solely focuses on revenue and ignores a company’s profitability. It fails to consider factors such as costs, expenses, and profit margins, which are crucial in evaluating a company’s financial health.
Variations across Industries
Different industries have varying levels of profitability and revenue generation patterns. Comparing P/S ratios across industries may not provide accurate insights due to industry-specific dynamics and business models.
Accounting Practices and Revenue Recognition
The P/S ratio relies on reported revenue figures, which accounting practices and revenue recognition policies can influence. Inaccurate or manipulated revenue figures can distort the ratio’s interpretation.
Interpreting Price-to-Sales Ratio
Low Price to Sales Ratio
A low P/S ratio may indicate an undervalued stock or a company facing temporary challenges. Further analysis is required to understand the underlying reasons and assess investment potential.
High Price to Sales Ratio
A high P/S ratio suggests that the market has high expectations for a company’s future revenue growth. However, it may also indicate an overvalued stock, warranting caution and thorough evaluation.
Comparing Ratios in the Industry
Comparing a company’s P/S ratio with industry benchmarks and competitors’ ratios provides valuable insights. If a company’s ratio is significantly higher or lower than its peers, it signifies unique market perceptions or competitive advantages.
Factors Affecting Price to Sales Ratio
Growth Prospects
Investors often value companies with strong growth prospects higher, leading to higher P/S ratios. Factors such as market expansion, innovative products/services, and increasing customer demand influence growth expectations.
Competitive Landscape
The competitive landscape plays a role in determining the P/S ratio. Companies operating in highly competitive markets may have lower ratios due to pricing pressures and thinner profit margins.
Market Sentiment
Market sentiment and investor behaviour can significantly impact a company’s P/S ratio. Positive sentiment and high demand for a company’s stock may drive the ratio higher, while negative sentiment can lead to a lower ratio.
Price to Sales Ratio vs. Price to Earnings Ratio
Key Differences
The P/S ratio focuses on revenue, while the Price to Earnings (P/E) ratio considers a company’s earnings. The P/S ratio is useful for companies with negative or low earnings, while the P/E ratio provides insights into profitability.
When to Use Each Ratio
The choice between P/S and P/E ratios depends on the specific analysis objectives. The P/S ratio is more suitable for start-up valuation, evaluating revenue-focused companies, or comparing businesses within the same industry. The P/E ratio is valuable when profitability is a primary consideration.
Price to Sales Ratio Case Study
Analyzing Company X’s Price-to-Sales Ratio
By examining Company X’s P/S ratio in conjunction with other financial metrics, investors can better understand the company’s market position, growth potential, and relative valuation.
Comparison with Competitors
Comparing Company X’s P/S ratio with its industry competitors provides insights into its relative market position. Outperforming competitors’ ratios may indicate a competitive advantage, while underperforming ratios may raise concerns.
Using Price-to-Sales Ratio in Investment Decisions
Long-Term Investment Strategy
Investors seeking long-term investments may consider the P/S ratio as one of many factors in their decision-making process. It can help identify undervalued stocks or companies with high growth potential.
Short-Term Trading Strategy
In the short term, changes in market sentiment and investor behaviour can impact stock prices and P/S ratios. Traders may utilize the P/S ratio to identify short-term trading opportunities based on market trends and price movements.
Good read: Best Investing books
Conclusion
The Price to Sales (P/S) ratio is a valuable tool for investors in evaluating a company’s market valuation and growth prospects. By comparing a company’s market capitalization to its total revenue, the P/S ratio provides insights into each dollar of sales and investors’ willingness to invest. Throughout this article, we have delved into the various aspects of the P/S ratio. We started by understanding its definition and calculation method. We then explored the advantages of using the P/S ratio, such as its simplicity, ability to compare companies, and its usefulness in valuing startups with no earnings.
But it’s crucial to recognize the limitations of the P/S ratio. It disregards profitability, varies across industries, and can be influenced by accounting practices and revenue recognition policies. As a result, it should be combined with other financial metrics and factors when making investment decisions. Interpreting the P/S ratio requires considering both low and high ratios in the context of the company’s specific circumstances and industry benchmarks. We also discussed factors that can affect the P/S ratio, such as growth prospects, the competitive landscape, and market sentiment.
We also compared the P/S ratio with the Price to Earnings (P/E) ratio, highlighting their key differences and the appropriate usage scenarios for each ratio. Furthermore, we examined a case study to demonstrate how the P/S ratio can be applied to analyse a company’s valuation and compare it with its competitors. Lastly, we answered frequently asked questions regarding the P/S ratio, addressing common queries about what constitutes a good ratio, the possibility of negative ratios, the implications of high ratios, and the differences between P/S and P/E ratios.
Closing thoughts
Maintaining a trading journal is invaluable, especially in turbulent and exciting times. Your notes hold hidden gems, waiting to be discovered months or years later. Patience, discipline and understanding of crowd behaviour are key to long-term success. Embrace contrarian thinking, focus on trends, and fearlessly capitalize on lucrative opportunities. Armed with your journal, confidently navigate the changing tides of trading, illuminating your path to prosperity.
FAQs on Demystifying the P/S Ratio
Q1: What is the Price to Sales ratio?
A1: The Price to Sales (P/S) ratio is a financial metric used to assess the relative value of a company’s stock. It is calculated by dividing a company’s market capitalization by its total revenue over a given period.
Q2: How do you interpret the Price to Sales ratio?
A2: Interpreting the P/S ratio involves comparing it to historical values, industry benchmarks, and competitor ratios. A higher ratio may indicate an overvalued stock, while a lower ratio could suggest an undervalued opportunity.
Q3: What are the advantages of using the Price to Sales ratio?
A3: The advantages of using the P/S ratio include its simplicity, ease of use, usefulness for comparing companies within the same industry, and its applicability for valuing startups or companies with no earnings.
Q4: What are the limitations of the Price to Sales ratio?
A4: The limitations of the P/S ratio include its sole focus on revenue and disregard for profitability, variations across industries, and susceptibility to accounting practices and revenue recognition policies.
Q5: How should I interpret a low Price to Sales ratio?
A5: A low P/S ratio may indicate an undervalued stock or a company facing temporary challenges. Further analysis is necessary to understand the underlying reasons and assess investment potential.
Q6: Is a high Price to Sales ratio always better?
A6: Not necessarily. A high P/S ratio may suggest high growth expectations but could also indicate an overvalued stock. Context and further analysis are essential in interpreting the ratio.
Q7: How does the Price to Sales ratio differ from the Price to Earnings ratio?
A7: The P/S ratio focuses on revenue, while the Price to Earnings (P/E) ratio considers a company’s earnings. The P/S ratio is useful for revenue-focused analysis, while the P/E ratio assesses profitability.
Q8: Can the Price to Sales ratio be used for valuation?
A8: Yes, the P/S ratio can be used as one of many valuation metrics. However, it should be combined with other financial indicators and considerations for a comprehensive valuation.
Q9: What factors affect the Price to Sales ratio?
A9: Factors affecting the P/S ratio include growth prospects, the competitive landscape, and market sentiment. Positive sentiment, strong growth prospects, and a favourable competitive position can influence a higher P/S ratio.
Q10: When should I use the Price to Sales ratio versus the Price to Earnings ratio?
A10: The choice between the P/S and P/E ratios depends on the analysis objectives. The P/S ratio is more suitable for start-up valuation, revenue-focused companies, or industry comparisons. The P/E ratio is valuable when profitability is a primary consideration.
Q11: How can I use the Price to Sales ratio in investment decisions?
A11: The P/S ratio can be used as one of many factors in investment decisions. It can help identify undervalued stocks, companies with high growth potential, or short-term trading opportunities based on market trends and price movements.
Q12: Is the Price to Sales ratio applicable across all industries?
A12: While the P/S ratio can be used in various industries, it’s important to consider industry-specific dynamics and business models. Comparing P/S ratios across industries may not provide accurate insights.
Q13: How can I analyze a company’s Price to Sales ratio?
A13: By examining a company’s P/S ratio in conjunction with other financial metrics, such as market position, growth potential, and relative valuation, investors can gain a deeper understanding of the company’s performance and make more informed decisions.
Q14: How does the Price to Sales ratio compare to its competitors?
A14: Comparing a company’s Price to Sales (P/S) ratio with its industry competitors provides insights into its relative market position. Outperforming competitors’ ratios may indicate a competitive advantage, while underperforming ratios may raise concerns.
Q15: How should I incorporate the Price to Sales ratio into a long-term investment strategy?
A15: Investors seeking long-term investments can consider the P/S ratio as one of many factors in their decision-making process. It can help identify undervalued stocks or companies with high growth potential.
Q16: Can the Price to Sales ratio be useful for short-term trading strategies?
A16: Yes, in the short term, changes in market sentiment and investor behaviour can impact stock prices and P/S ratios. Traders may utilize the P/S ratio to identify short-term trading opportunities based on market trends and price movements.
Q17: How important is the Price to Sales ratio in investment analysis?
A17: The Price to Sales ratio is one of several financial metrics used in investment analysis. While it provides valuable insights into a company’s market valuation and growth prospects, it should be used alongside other indicators for a comprehensive assessment.
Q18: What role does market sentiment play in interpreting the Price to Sales ratio?
A18: Market sentiment and investor behaviour can significantly impact a company’s Price to Sales (P/S) ratio. Positive sentiment and high demand for a company’s stock may drive the ratio higher, while negative sentiment can lead to a lower ratio.
Q19: How does the Price to Sales ratio account for companies with no earnings or negative earnings?
A19: For startups or companies with negative earnings, the P/S ratio can be a useful tool for valuation. It focuses on revenue generation potential rather than profitability, making it applicable in such cases.
Q20: How reliable is the Price to Sales ratio as a valuation metric?
A20: The Price to Sales ratio is one of many valuation metrics used in investment analysis. While it provides insights into a company’s market valuation, it should be used in conjunction with other financial indicators and considerations for a comprehensive valuation.
Q21: Can accounting practices manipulate or influence the Price to Sales ratio?
A21: The Price to Sales (P/S) ratio relies on reported revenue figures, which can influence accounting practices and revenue recognition policies. Inaccurate or manipulated revenue figures can distort the interpretation of the ratio.
Q22: How does the Price to Sales ratio relate to a company’s profitability?
A22: The P/S ratio focuses on revenue and does not directly consider a company’s profitability. It is essential to consider profitability metrics, such as the Price to Earnings (P/E) ratio, alongside the P/S ratio for a comprehensive analysis.
Q23: What are some alternatives to the Price to Sales ratio for valuation purposes?
A23: Some alternatives to the P/S ratio for valuation purposes include the Price to Earnings (P/E) ratio, Price to Cash Flow (P/CF) ratio, and discounted cash flow (DCF) analysis. These metrics provide additional insights into a company’s financial health and valuation.
Q24: Can the Price to Sales ratio be used for companies in different stages of growth?
A24: Yes, the Price to Sales ratio can be used for companies in different stages of growth. It is beneficial for startups or companies with low or negative earnings, as it focuses on revenue generation potential.
Q25: How frequently should I monitor the Price to Sales ratio for investment purposes?
A25: The frequency of monitoring the Price to Sales (P/S) ratio depends on individual investment strategies and the specific circumstances of the analysed company. Regular monitoring is recommended to stay.
Closing thoughts