
Cracking the Code: The Baltic Dry Index Exposes the Illusion
Jan 27, 2025
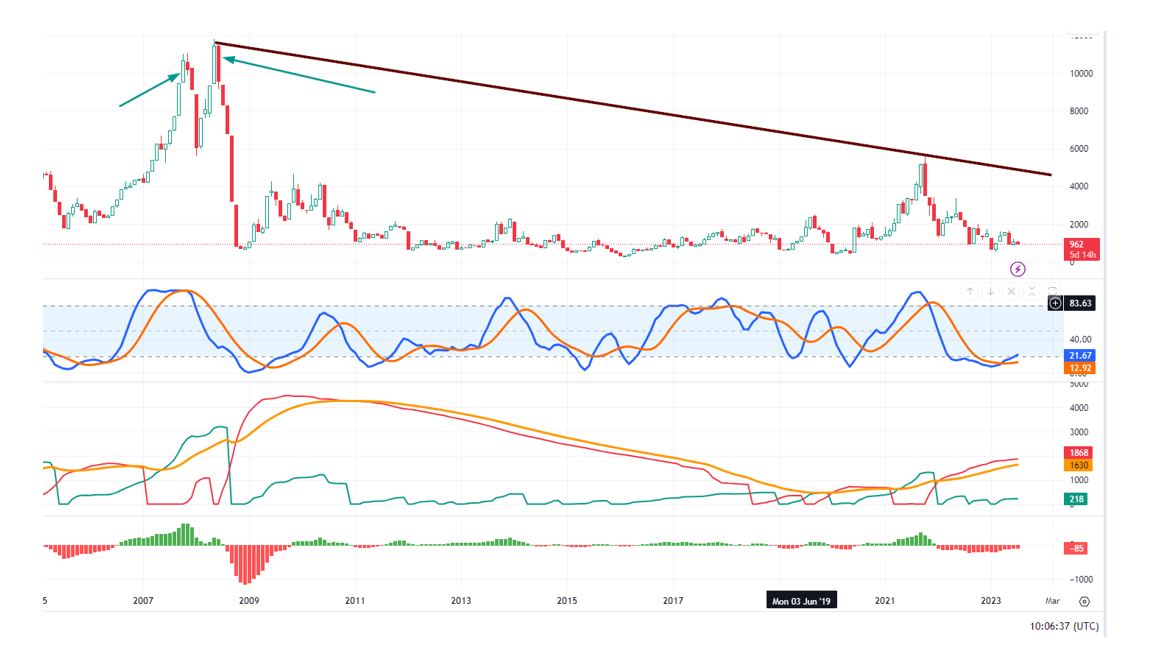
Take a hard look at the Baltic Dry Index (BDI) chart below. Greenspan’s desperate attempts to flood the system with liquidity were nothing more than a feeble bandage on a gaping wound. The sheer force of the free market crushed his efforts—how do we know? The BDI didn’t just climb; it roared to new highs until May 2008. And then, just like that, the ascent was obliterated.
What happened? Free market forces were smothered.
The BDI delivers an unflinching verdict: the U.S. economy—along with much of the West—never truly recovered. The patient should have flatlined long ago. Instead, it’s being kept on life support, pumped full of artificial stimulants (read: cash) while every last drop is wrung from the system. And the real cost? Skyrocketing inflation—not the doctored numbers peddled by the Fed and the BLS, but the brutal reality felt in the streets.
Suppose one examines the economies of most Western countries. In that case, it becomes apparent that wealth revolves around the stock market, with many companies producing little in the way of tangible products – things essential for survival, such as food, energy, and basic medicines.
Taking a broader perspective, it becomes evident that despite the numerous cash infusions into the economy, the Baltic Dry Index (BDI), a prominent economic indicator, continued its upward trend until it peaked in 2008. Subsequently, even with trillions of dollars added to the system, the BDI performed like a sick creature.
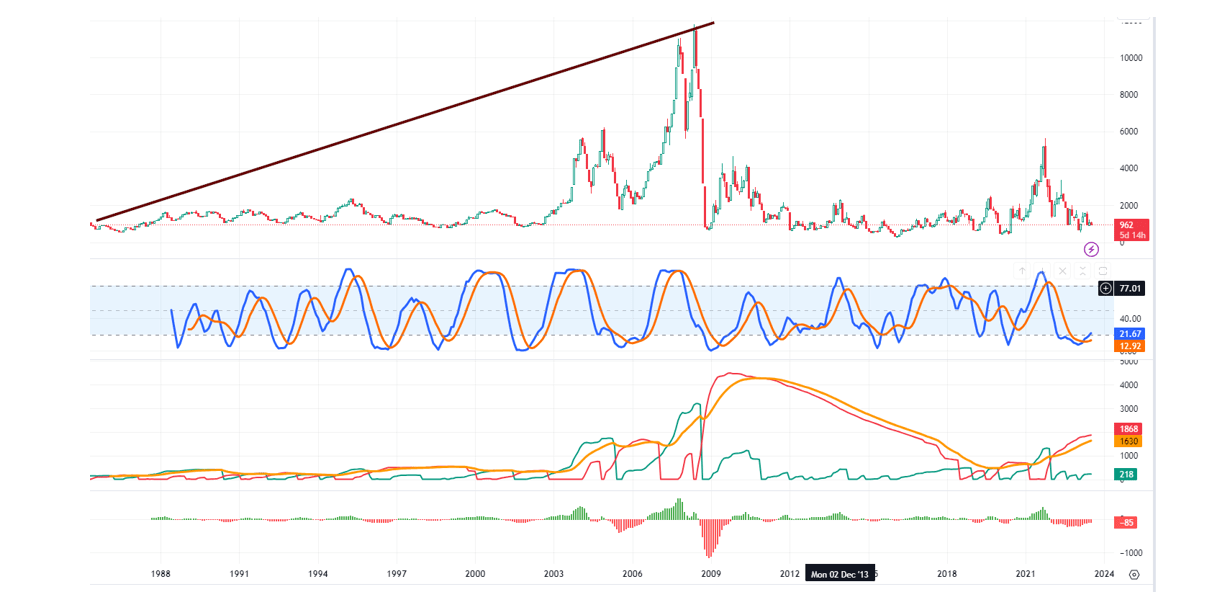
Baltic Dry Index Chart: Tracking Trends from 1988 to 2023
Unmasking the Illusion: The Baltic Dry Index and Copper Prices Tell the True Economic Story
The Baltic Dry Index (BDI) serves as a relentless barometer of global economic health, cutting through the smoke and mirrors of financial manipulation. In May 2008, the BDI reached a pinnacle of 11,793, signalling robust global trade. Fast forward to October 4, 2021, even after the U.S. government’s colossal injection of $5 trillion to combat the COVID-19 economic downturn, the BDI peaked at a mere 5,650—not even half of its 2008 zenith. As of February 2025, the BDI languishes around 792, a stark reminder that despite unprecedented monetary interventions, the index has been on a downward spiral since 2008. This trajectory exposes the so-called global economic recovery as a grand illusion, propped up by artificial means.
The implications are dire: this chart doesn’t just suggest but forewarns of an impending reckoning—a financial cataclysm echoing the 1929 crash, poised to obliterate vast sums of wealth. Our only defence against this looming disaster is a vigilant analysis of crowd psychology and governmental manoeuvres.
Strategic Market Navigation Using the Baltic Dry Index and Copper Prices
The BDI offers an unvarnished, real-time snapshot of the global economy by tracking shipping rates for essential raw materials. Its sensitivity to commodity demand fluctuations makes it an invaluable tool for pinpointing optimal market entry and exit strategies.
From 1985 through 2025, the BDI’s pattern is telling. Despite aggressive liquidity infusions into the global economy, the index’s peak in 2008 and its subsequent decline suggest that the much-lauded economic resurgence is more mirage than reality.
Complementing the BDI is copper, often dubbed “Dr. Copper” for its diagnostic prowess in economic health assessment. Copper’s pervasive industrial applications make its price movements highly responsive to economic shifts.
As of February 14, 2025, copper prices stand at $4.66 per pound, a significant rise from previous years. This surge, however, isn’t solely indicative of industrial demand but also reflects supply constraints and speculative activities. Notably, in May 2024, copper prices soared to an all-time high of $5.20 per pound, driven by the burgeoning green energy sector’s insatiable appetite for the metal. This demand surge has precipitated a wave of thefts and illicit mining activities, particularly in regions like South Africa, where infrastructure is pillaged for its copper content. These developments underscore the metal’s critical role in the modern economy and the lengths to which entities will go to procure it.
The interplay between the BDI and copper prices offers investors a strategic compass. An upswing in both metrics typically signals economic vigour, suggesting a favourable climate for market entry. Conversely, simultaneous declines may herald economic contraction, advising caution or market exit.
However, the objective isn’t flawless market timing but rather informed decision-making. The BDI and copper prices are potent instruments in an investor’s arsenal but should be employed alongside a holistic investment strategy that accounts for individual financial objectives, risk tolerance, and prevailing market conditions.
In a financial landscape rife with obfuscation, the Baltic Dry Index and copper prices stand out as beacons of clarity, daring us to confront the unvarnished truth of our economic reality.

Conclusion
While the Baltic Dry Index chart suggests long-term economic concerns, the stock market disregards this. The index hasn’t come close to its May 2008 highs, and inverted yield curves in many countries haven’t affected the market yet.
However, it’s worth noting that recessions typically begin 6 to 24 months after the Fed stops hiking rates. The last significant rate-hiking cycle started in the summer of 2004, with 17 hikes of 25 basis points each, reaching 5.25%.
The subsequent bear market and the stock market crash didn’t happen immediately. The debt and equity markets were strong even a year after the final Fed hike in June 2006. Signs of trouble only emerged in late 2007, with things falling apart in 2008.
Prudent investors should shift from FOMO stage stocks to NCA (Nobody Cares About) stage ones. A market crash is unlikely until bullish sentiment reaches and stays at 60 for two consecutive weeks.
While market volatility is expected, we anticipate the next pullback will be a buying opportunity. Bullish sentiment dropping below its historical average of 38.5 for two consecutive weeks supports the idea that markets will trend higher post-pullback.