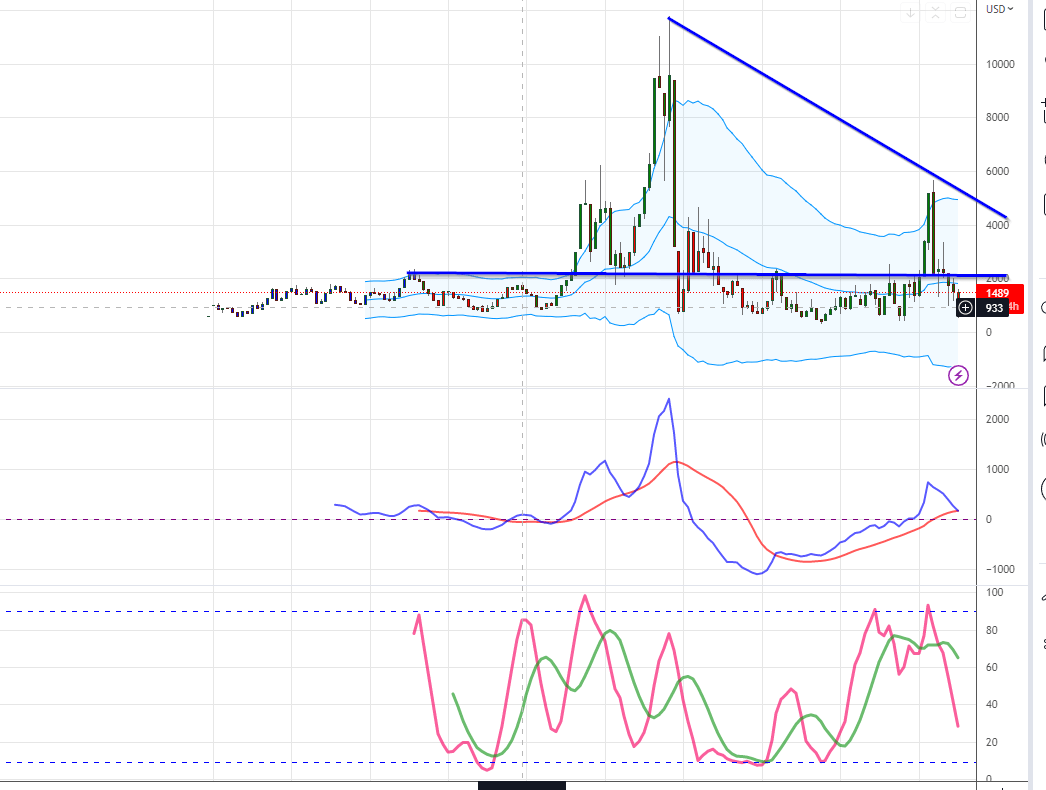
The Flaws of the Baltic Dry Index as a Leading Economic Indicator
April 2, 2023
The Baltic Dry Index (BDI) is a widely-used economic indicator that measures the cost of shipping raw materials such as coal, iron ore, and grain. It is believed to reflect global trade and economic activity changes, making it a valuable tool for investors and policymakers. However, the BDI’s reliability as a leading economic indicator has been increasingly questioned recently.
One of the main flaws of the BDI as a leading economic indicator is that it only measures the cost of shipping raw materials and does not consider other factors that affect global trade and economic activity. Changes in government policies, geopolitical events, and technological developments can significantly impact international trade and economic activity, but these factors are not reflected in the BDI. As a result, relying solely on the BDI to make investment decisions can be risky.
Another flaw of the BDI is that it is heavily influenced by supply and demand factors in the shipping industry and can be affected by changes in shipping capacity and vessel availability. This means that even if there are no changes in global trade or economic activity, changes in the shipping industry can still significantly impact the BDI. This makes it difficult to interpret the BDI’s movements meaningfully.
The Transformation of the Baltic Dry Index from a Leading to a Lagging Economic Indicator
The evolution of the Baltic Dry Index (BDI) into a lagging economic indicator emphasises the importance of investors broadening their information sources and not depending solely on a single data point. The Baltic Dry Index (BDI) was formerly regarded as a dependable gauge of worldwide economic performance, as it gauges the expense of transporting essential resources like coal, iron ore, and grains. However, changes in the shipping industry and the rise of alternative transportation methods have made the BDI less reliable as a leading indicator.
Investors must be cautious when relying on any single data point to make investment decisions. Instead, they should consider a variety of indicators, including economic data, market trends, and company-specific information. By diversifying their sources of information, investors can make more informed decisions and avoid the risks of over-reliance on a singular data point.

Since its peak in 2008, the BDI has been consistently signalling economic distress. Based on its readings, the economy should have been in a prolonged slump, and the stock market should have never recovered. However, the index’s declining relevance is partly due to the massive infusion of hot money by the US Federal Reserve into the market since the crash of 2008-09. The latest example is the $5 trillion infusion during the COVID-19 crisis.
The reality is that other economic indicators (Copper) are much more reliable than the Baltic Dry Index. Copper remains a reliable bellwether for the global economy’s health and stock market movements. It continues to be a leading indicator for upturns and downturns in these cycles.
The Need for a More Nuanced Approach to Economic Analysis
This contrarian perspective challenges the prevailing narrative that the Baltic Dry Index is still a valuable gauge of economic health. Instead, its transformation into a lagging economic indicator reflects the Fed’s influence on the market and highlights the need for a more nuanced approach to economic analysis.
To make informed investment decisions, investors must adopt a comprehensive approach to economic analysis that goes beyond the traditional reliance on US lagging economic indicators such as the BDI. Instead, a broader range of data points should be considered, including Mass Psychology, price action, investor sentiment, and geopolitical factors. Doing so can gain a more nuanced understanding of the global economy, leading to more informed investment decisions.
The Role of Technology in the Shipping Industry and Its Impact on the Baltic Dry Index
The shipping industry has undergone significant technological advancements in recent years, including larger vessels, automation, and digitalization. These changes have significantly impacted the industry’s efficiency and cost-effectiveness. Still, they have also affected the reliability of the Baltic Dry Index as a leading economic indicator. For example, using larger vessels can lead to fluctuations in shipping capacity and vessel availability, impacting the BDI’s movements.
The Importance of Geopolitical Factors in Economic Analysis
Geopolitical factors are crucial in economic analysis, as they can significantly impact global trade and economic activity. For example, trade policies, such as tariffs and quotas, can affect the flow of goods and services between countries, leading to changes in supply and demand and potentially impacting the global economy. Similarly, political instability, such as civil unrest or regime changes, can disrupt trade and investment, leading to economic uncertainty and potential market volatility.
Sanctions are another geopolitical factor that can significantly impact global trade and economic activity. They can limit a country’s ability to trade with other countries, potentially leading to supply chain disruptions and changes in international trade patterns. Sanctions can also impact specific industries or companies, leading to changes in market dynamics and potential investment opportunities.
Investors who consider geopolitical factors when making investment decisions can develop a better understanding of the global economy and potential risks and opportunities. By monitoring geopolitical developments and their potential economic impact, investors can make more informed investment decisions and potentially avoid significant losses.
The Role of Investor Sentiment in Economic Analysis
Investor sentiment can also significantly impact the stock market and global economic activity. By monitoring investor sentiment, investors can gain insights into market trends and potential opportunities. It’s worth noting that various factors, such as media coverage and social media, can sway investor sentiment. Therefore, it’s essential to consider multiple sources of information when analysing investor sentiment.
Conclusion
The story of the Baltic Dry Index warns investors about the dangers of relying too heavily on a single economic indicator. Once a reliable gauge of global economic activity, the BDI has become a lagging indicator, rendering it less useful for investors. In light of this, investors must exercise caution when interpreting economic indicators and take a more nuanced approach to economic analysis. This requires looking beyond the BDI to other data points, such as financial data, market trends, company-specific information, geopolitical factors, and investor sentiment.
Investors can make more informed investment decisions by considering a range of factors that contribute to the global economy, providing them with a more comprehensive understanding of the markets. However, it’s important to note that investor sentiment can be influenced by media coverage and social media, underscoring the need for caution when relying on a single source of information. In conclusion, the BDI’s fall from grace highlights the importance of adopting a nuanced approach to economic analysis and avoiding the risks of over-reliance on a single data point.
FAQs
| FAQ | Answer |
|---|---|
| What is the Baltic Dry Index? | The Baltic Dry Index (BDI) is an economic indicator that measures the cost of shipping raw materials such as coal, iron ore, and grain. It is believed to reflect changes in global trade and economic activity. |
| What are the flaws of the BDI as a leading economic indicator? | The BDI only measures the cost of shipping raw materials and does not consider other factors that affect global trade and economic activity. It is also heavily influenced by supply and demand factors in the shipping industry and can be affected by changes in shipping capacity and vessel availability. |
| What is the transformation of the BDI into a lagging economic indicator? | The BDI’s transformation into a lagging economic indicator reflects changes in the shipping industry and the rise of alternative transportation methods, making it less reliable as a leading indicator. |
| What is the role of technology in the shipping industry and its impact on the BDI? | The shipping industry’s technological advancements, such as larger vessels, automation, and digitalization, have significantly impacted the industry’s efficiency and cost-effectiveness. However, they have also affected the reliability of the BDI as a leading economic indicator. |
| Why are geopolitical factors important in economic analysis? | Geopolitical factors, such as trade policies, sanctions, and political instability, can significantly impact global trade and economic activity. These factors are not reflected in the BDI, making it essential for investors to consider them when making investment decisions. |
| What is the role of investor sentiment in economic analysis? | Investor sentiment can significantly impact the stock market and global economic activity. By monitoring investor sentiment, investors can gain insights into market trends and potential opportunities. However, it’s essential to consider multiple sources of information when analysing investor sentiment. |
Read, Learn, Grow: Other Engaging Articles You Shouldn’t Miss


