
The crowd sees what happened. The trend sees what comes next.
June 5, 2026
Overview
• The “death of the dollar” narrative continues to gain followers. Most experts remain convinced the dollar’s best days are behind it. But what if they are wrong? Not slightly wrong, but terribly wrong?
• The Mother of All Buy signal generated on May 7, 2025 remains valid. Current market action actually suggests that a meaningful pullback would be a bullish development. The crowd is still far from euphoric, and without widespread euphoria the odds continue to favour viewing sharp corrections as opportunities rather than reasons to panic.
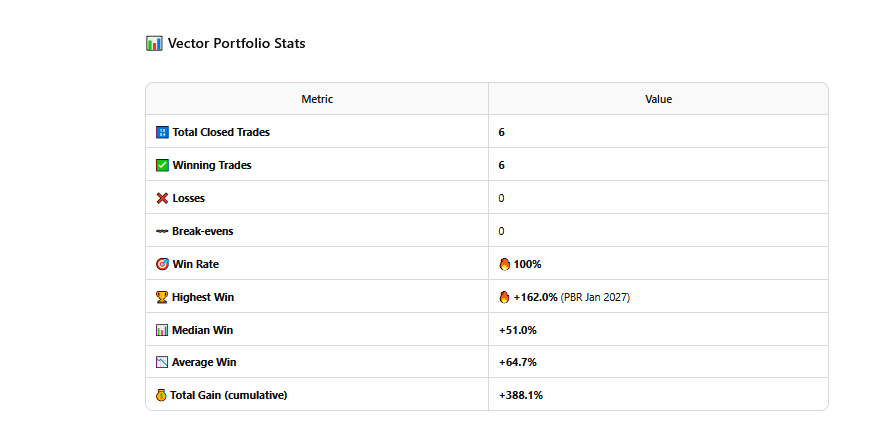
• The Vector Portfolio continues to maintain its 100% closed-trade win rate. Since the last update, two more winners were added to the list: AREC, which delivered a quick gain of roughly 30%, and the second NAK position, which was closed out for a gain of approximately 94%. Equally interesting is that every open position in the portfolio remains profitable and in the black.
We expand on several of these points below, as some require additional context and explanation.
Sentiment Remains the Biggest Contradiction
A quick look at the sentiment landscape from last week before we update it with the latest data. Sentiment readings remain beyond unusual. Despite all the FOMO in AI and AI-related sectors, bullish sentiment continues to trade well below its historical average of 38. Last week it plunged to a mind-numbing reading of 30. One would think the market had already crashed and burned. Instead, the opposite is taking place.
The most logical explanation is that a large segment of investors still does not have meaningful skin in the game and is only now rushing in, hoping to claim a piece of the AI boom. That would help explain the increasingly erratic action across many technology names.
This view is reinforced by the neutral camp surging to 50, a level not seen in many years. At first glance, the closest comparable reading appears to have occurred during the COVID era. The conclusion is relatively straightforward. The technology sector, led by AI-related stocks, needs to let out a sizeable amount of steam. The only issue is timing. Markets move on their schedule, not yours, not ours, and certainly not when it would be most convenient.
Eventually, many buyers become sellers, not because they suddenly dislike the story, but because they want to lock in profits. When enough participants reach that conclusion at the same time, profit-taking can quickly turn into panic selling, and that is usually what fuels sharp pullbacks.
Because sentiment is still not broadly euphoric, any strong correction would likely still need to be viewed through a bullish lens.
The Market Doesn’t Break from Euphoria. It Breaks When Liquidity Disappears.
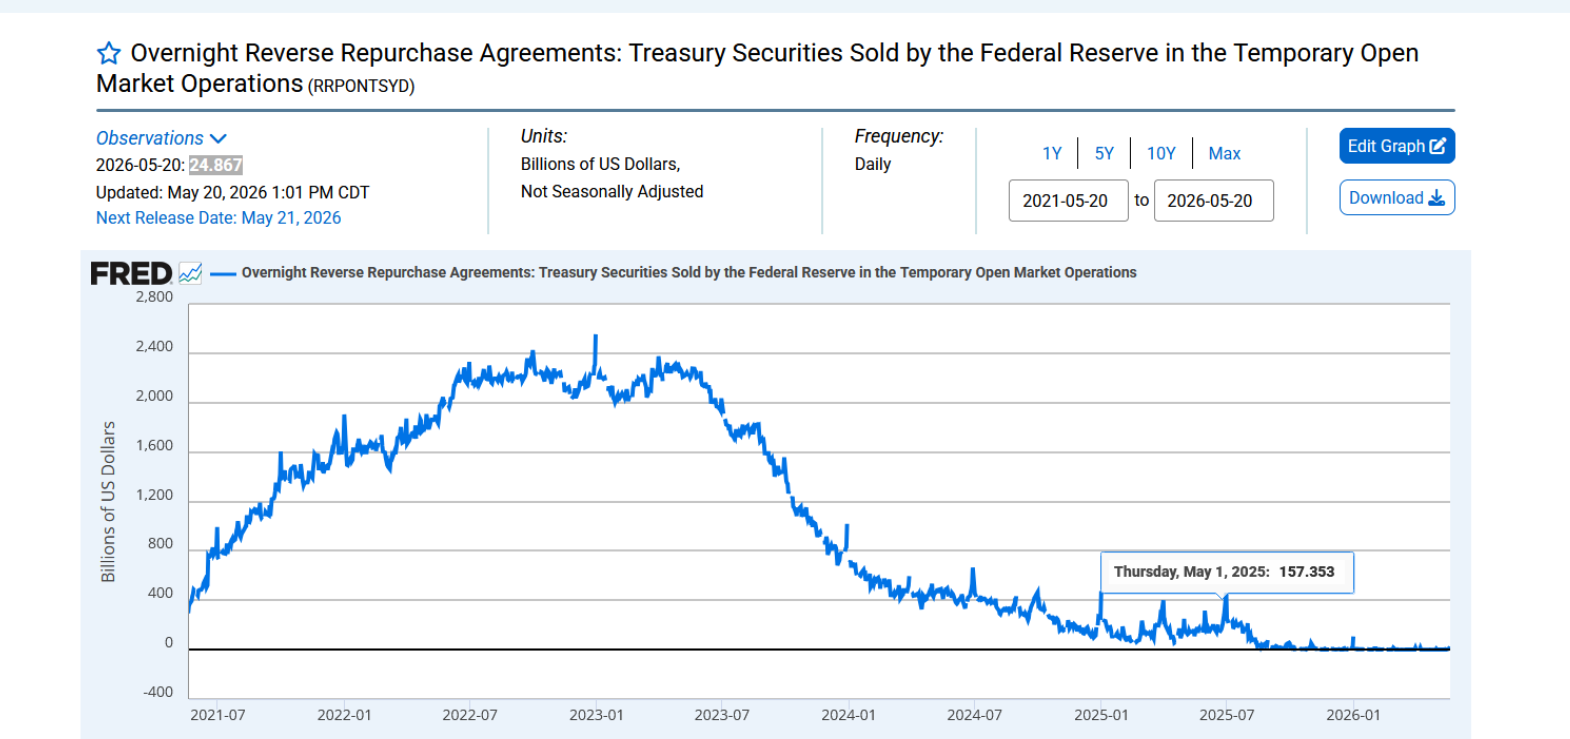
The Fed’s Reverse Repo Facility has collapsed from roughly $2.5 trillion in 2022 to just $24.9 billion today. The chart confirms the scale of that collapse clearly. What was once an enormous reservoir of parked cash has now been almost entirely drained.
That matters because the RRP acted like a giant liquidity storage tank. For the past two years, markets quietly benefited as that parked cash flowed back into Treasury bills, funding markets, and risk assets, helping stocks rally even while the Fed was supposedly tightening through QT. Now that reservoir is nearly empty.
The next phase becomes harder because future Treasury issuance must increasingly find real buyers instead of relying on excess parked liquidity. During the RRP drawdown phase, markets benefited from a hidden liquidity tailwind as idle money steadily re-entered the system. That tailwind is now largely gone.
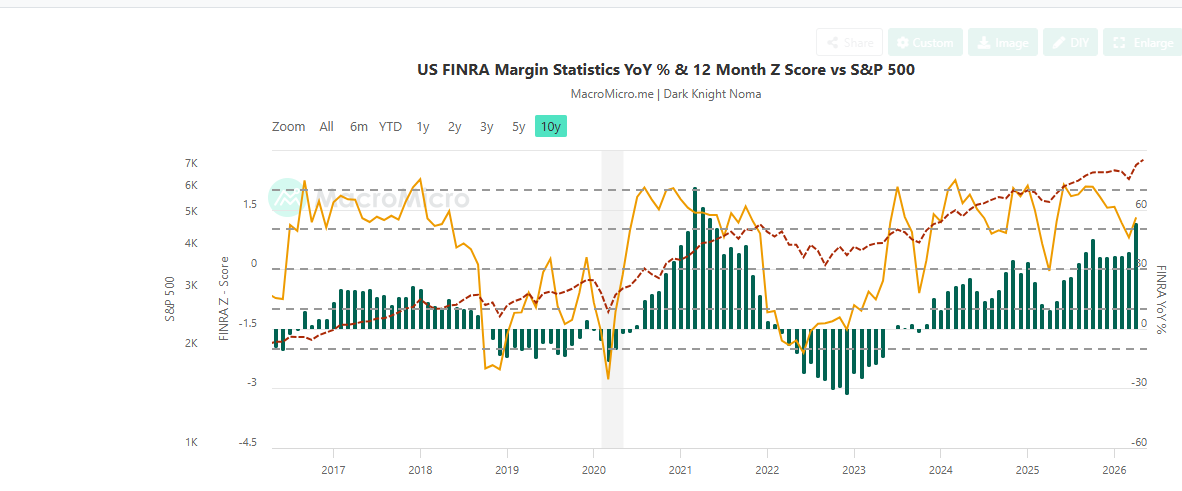
At the same time, inflation remains sticky enough to limit aggressive rate cuts, while deficits, leverage, and refinancing needs continue rising. Treasury issuance remains massive. Margin debt has surged over 50% year over year. Equities continue pushing higher while credit and duration markets show weaker participation underneath. That combination historically resembles late-cycle environments far more than early-cycle ones.
One of the biggest misconceptions is that markets crash simply because borrowing, speculation, or euphoria becomes excessive. Excess alone usually does not end a bull market. As long as liquidity remains abundant and borrowing stays accessible, markets can continue climbing far longer than most expect.
Crashes usually begin when liquidity tightens while leverage remains high. Investors rush to lock in profits, fear spreads, leverage unwinds, and selling accelerates as access to liquidity weakens. In many cases, it is the loss of liquidity, not optimism, that triggers the real breakdown.
Another important nuance is that recent liquidity expansion has been driven more by Treasury cash drawdowns than by outright Fed balance sheet expansion. The Fed’s balance sheet only increased modestly, while the Treasury General Account fell sharply, injecting cash into the system through government spending. That distinction matters because Treasury cash deployment is temporary. Once Treasury rebuilds its cash balance through issuance, liquidity can begin flowing back out again unless another offset appears.
This does not guarantee an immediate crash. Late-cycle liquidity environments can persist longer than expected, especially when fiscal spending, AI-driven investment, and nominal growth continue supporting asset prices. In fact, some of the strongest melt-ups in history occurred near the end of cycles precisely because investors became conditioned to believe liquidity would always remain available.
But the hidden liquidity cushion that softened the impact of QT is largely gone. The system is shifting from an era of excess liquidity redistribution to one where capital must increasingly compete against massive government financing needs. That leaves markets structurally more sensitive to higher yields, refinancing pressure, funding stress, and leverage shocks than they were while trillions still sat inside the reverse repo facility.
Conclusion
Markets often do not crash the moment speculation becomes excessive. In many historical cycles, the first major pullback is mistaken for the real collapse, but instead it resets sentiment and clears weaker investors out before the market stages one final powerful rally.
That happened in 1998 after the Asian crisis and the LTCM collapse. Markets dropped hard, fear surged, and many believed the bull market was over. Instead, liquidity conditions improved, confidence returned, and the market entered the explosive final phase of the dot-com bubble in 2000.
A similar pattern appeared in 2007. Early cracks showed up in housing and credit markets months before the actual financial crisis. Markets sold off, recovered, and then pushed to new highs before the system eventually broke down later.
The common pattern is this:
• liquidity supports speculation,
• an early scare causes a pullback,
• markets recover,
• confidence returns stronger than before,
• then leverage and speculation expand even further.
Today’s environment shares some similarities:
• strong stock market gains,
• rising leverage and margin debt,
• AI-driven enthusiasm,
• low volatility,
• and liquidity still supporting markets despite tightening underneath.
At the same time, an important hidden liquidity source, the Fed’s Reverse Repo Facility, has mostly been drained. That means future market support may depend more heavily on government spending, real buyers for Treasury debt, and actual monetary easing rather than leftover excess liquidity.
But the system is becoming more dependent on continuous liquidity and cheap borrowing to keep moving higher. Historically, that often leads to:
• a sharp pullback,
• followed by another strong rally,
• before the real breakdown eventually appears later.
The opposite often happens near major bottoms. Liquidity conditions quietly improve before confidence returns, allowing markets to stabilise and recover while most investors still expect further downside.
Bullish sentiment is still not particularly high, and the VPS system is not yet showing full coherence toward either broad bullishness or bearishness from a market-wide perspective. However, the component that measures credit-market stress is continuing to show signs of strain. As we stated before, that usually acts as a warning signal, but one that still needs to align with broad market euphoria before becoming truly dangerous.
The JOY indicator is also showing rising complacency, though nothing extreme yet. So, for now, the broader outlook remains intact.
The SPX could still spike toward 7500 before a meaningful pullback takes hold. With bullish sentiment remaining so subdued, what we stated last week continues to apply: Market Update, May 12, 2026
The above scenario largely came to pass. Now let’s see if the setup outlined below follows through as well.
A potential retest of the 6850 to 6930 range, followed by a push to new highs, provided bullish sentiment is not pushing toward 60. What comes after that we’ll deal with when it is directly in front of us, but it likely involves a sharp selloff, a partial recovery, and then a drawn-out, frustrating topping formation. Market Update, May 1, 2026
Sentiment and Market Update
Bullish sentiment has risen slightly, but remains unusually subdued, trading roughly three points below its historical average of 38. Bearish sentiment, meanwhile, has been stuck in the 40 to 45 range for several weeks.
Looking at the more detailed sentiment measures, such as the Joy Indicator, we do not see signs of extreme complacency. Complacency has increased, but nothing that stands out as excessive. The VPS, which tracks more than 15 separate measurements, continues to show a lack of coherence.
In simple terms, we do not have an extremely bullish or bearish setup. The only emotion that continues to trend higher, albeit slowly, is uncertainty. That leads us to a somewhat counterintuitive conclusion. A decent washout would most likely prove to be a buying opportunity. Why? Because a sharp pullback in the indices, or a hard selloff in several leading technology names, would have a dramatic impact on fear levels.
Markets rarely crash when bullish sentiment is already subdued. So unless the data changes materially, sharp pullbacks should be embraced, not feared.
The conclusion is relatively straightforward. The technology sector, led by AI-related stocks, likely needs to let out a sizeable amount of steam. The only issue is timing. Markets move on their schedule, not yours, not ours, and certainly not when it would be most convenient. Until then, the data continues to suggest that fear spikes are opportunities and not reasons to run for the exits.
Positioning and Portfolio Updates
Positioning matters more than prediction, especially in fragmented markets like this. That remains the core philosophy behind both the Vector Portfolio and the Bread and Butter Portfolio. Despite the volatility and constant narrative shifts, the Vector Portfolio continues to maintain a 100% closed-trade win rate, with the average gain per closed position now standing at roughly 80.25%. The Bread and Butter Portfolio, designed for lower-risk positioning, continues to show a similar pattern, with every closed position exited at a profit so far
The Vector Portfolio continues to maintain a 100%-win rate, with another winner recently added to the list.
Currently, we have three open positions and all three are profitable. We continue to maintain our objective of keeping no more than five positions open at any given time. The hard ceiling is seven, but so far, we have managed to stay at five or fewer.
The Bread and Butter Portfolio, which is designed for lower-risk positioning, continues to exhibit a similar pattern. To date, every closed position has been exited at a profit.
The Dollar Refuses to Die
The interesting part is that the rhetoric surrounding the dollar continues unabated. According to the critics, it’s dead, dying, doomed, finished, and headed for oblivion. Yet despite all the negatives lined up against it, the dollar is holding up surprisingly well. In fact, the pattern suggests the opposite outcome may be possible. The dollar Index could rally, potentially all the way into the 108 to 109 range.
What makes this even more interesting is that the yen could rally alongside the dollar. Add another layer of confusion and it’s possible that precious metals and commodities could rally at the same time. Under normal circumstances, that combination would raise eyebrows.
So, what does it mean?
First, it would be another sign that inflation is real. Not the popular definition of inflation, which focuses on rising prices. Rising prices are the symptom. Inflation, in its purest form, is an expansion of the money supply. Second, it would provide another strong confirmation that the Resource Remobilisation Supertrend is active and may continue to strengthen.
We are living through a period that often appears strange, but things usually only look strange when viewed through an outdated lens. The old order is changing. Some will welcome it; others will view it as a disaster. We prefer the observer’s approach. Trend change is inevitable. Some trends last years, others decades, and a few endure for generations. Some only appear permanent because our own lifespan is limited.
Going forward, many developments will seem unusual, but one principle is unlikely to change. Strong corrections and crashes should be embraced, especially when fear surges and quality assets are being sold indiscriminately.
Even the nastiest bear markets produce powerful countertrend rallies when fear reaches extreme levels. The goal is not to predict exactly how long a bull or bear market will last. Keep it simple. Buy when fear is surging and blood is flowing in the streets. It’s even more bullish when some of that blood is yours. Sell when euphoria is running wild.
You are unlikely to buy the exact bottom or sell the exact top, but that was never the objective. The objective is to be positioned before the crowd realises the trend has changed.
Special Offer
If you find this sort of thinking interesting where vector mass psychology, sentiment and technical analysis is used to spot upcoming trends and new opportunities then you can take advantage of the special offer.
Subscribers joining during this period will also retain ongoing access to the Vector Portfolio.
Readers may choose either monthly or annual billing under the trial offer structure. As always, subscriptions may be cancelled at any time directly through the account dashboard.
Trial Offer Converting to Monthly Subscription ($49.99)
Random Musings: A Strange Quirk of Human Nature
While the world appears increasingly chaotic, there is no requirement that you allow that chaos to dominate your life. Everything you think and feel is filtered through perception, and perception is shaped by the data you choose to focus on. On your worst day, you are still likely better off than millions of people around the world.
A day is simply a day. It only becomes good or bad after we paint it with our own colours.
What is strange is that we spend enormous amounts of time worrying about temporary setbacks, inconveniences, market corrections, political drama, and countless other events that will eventually pass. Yet the one event none of us can avoid, the end of our lives, receives remarkably little attention.
There is no recovering from that final event. No second chance. No reset button. Yet most people rarely dwell on it. Instead, we worry endlessly about things that, in the grand scheme of life, are little more than brief interruptions.
Perhaps that is a blessing. Perhaps it is simply human nature.
As Marcus Aurelius observed:
“You could leave life right now. Let that determine what you do and say and think.”
A useful reminder that time is finite, panic is optional, and perspective is often the rarest asset of all.

Epiphanies and Insights: Articles that Spark Wonder